In 1980, consumer price inflation in the United States reached 13.5%. A jump that large might seem to signal a booming economy, yet in the first half of that year the U.S. economy actually slid into recession.
This strange combination of rising prices, falling output and growing unemployment is called stagflation. The word blends stagnation, meaning an economic slump, with inflation, meaning rising prices, and is generally credited to British politician Iain Macleod, who used it in a 1965 speech to Parliament.
Setting it side by side with inflation, whose name it resembles, and with deflation, its opposite, shows why stagflation is considered one of the trickiest economic situations.

Stagflation vs. inflation: what is the difference?
Both terms describe rising prices. The difference lies in what output and jobs are doing while prices climb.
What is inflation?
Inflation is a sustained rise in the general price level of goods and services. Because the same amount of money buys fewer things, it is also described as a fall in the value of money.
The most familiar kind of inflation appears when the economy is doing well. As jobs and incomes grow, more people want to buy things, and prices rise when supply cannot keep up with demand. This is called demand-pull inflation, and the usual remedy is for the central bank to raise its policy rate to cool overheated demand. The same thing happens when too much money is pumped into the economy and its value falls.
That is why traditional economics held that prices and unemployment move in opposite directions: when prices rise, unemployment falls, and when unemployment rises, prices settle down. This relationship is drawn as the Phillips curve.
What is stagflation?
Stagflation is what happens when that rule breaks down. Prices keep rising while output shrinks and the unemployment rate climbs. Even though the economy is weak, prices refuse to come down.
The most common cause is a supply shock. When the price of a raw material used by almost every industry, such as oil, suddenly jumps, companies' production costs rise all at once. Firms have little choice but to raise prices or cut production, so rising prices and recession arrive together. This kind of price rise is called cost-push inflation.
Once it starts, expectations make the problem worse. If people believe prices will keep rising, they demand higher wages, and companies pass those higher labor costs back into prices. This loop, in which wages and prices push each other up, is called the wage-price spiral.
In fact, a warning that this could happen had already been issued. In the late 1960s, American economists Milton Friedman and Edmund Phelps argued that once people start expecting inflation and change their behavior, the trade-off between prices and unemployment cannot last long. The 1970s were the decade when that argument came true.
Stagflation is tricky because the remedies clash. Raising interest rates to fight inflation makes the slump worse, while pumping money in to revive the economy pushes prices even higher. That is also why the misery index, which American economist Arthur Okun (known for Okun's law) created by adding the inflation rate to the unemployment rate, was quoted so often in this period.
In the end, the United States chose to tame inflation first. Paul Volcker, who became chair of the Federal Reserve in 1979, raised the policy rate to 20% in 1981. Only after paying the heavy price of unemployment topping 10% at the end of 1982 did inflation fall to around 3% in 1983.
Side-by-side comparison
Adding deflation, which moves in the opposite direction, makes the differences clear. The three are hard to tell apart from a single price indicator; the consumer price index has to be read together with GDP growth and the unemployment rate.
| Category | Inflation | Deflation | Stagflation |
|---|---|---|---|
| Prices | Rise | Fall | Rise |
| Economy | Usually booming or overheating | Recession | Recession |
| Unemployment | Tends to fall | Rises | Rises |
| Typical causes | Rising demand, growing money supply | Weak demand, bursting asset bubbles | Supply shocks such as soaring raw material prices |
| Usual policy response | Raising interest rates | Cutting interest rates, more government spending | A dilemma between prices and growth |
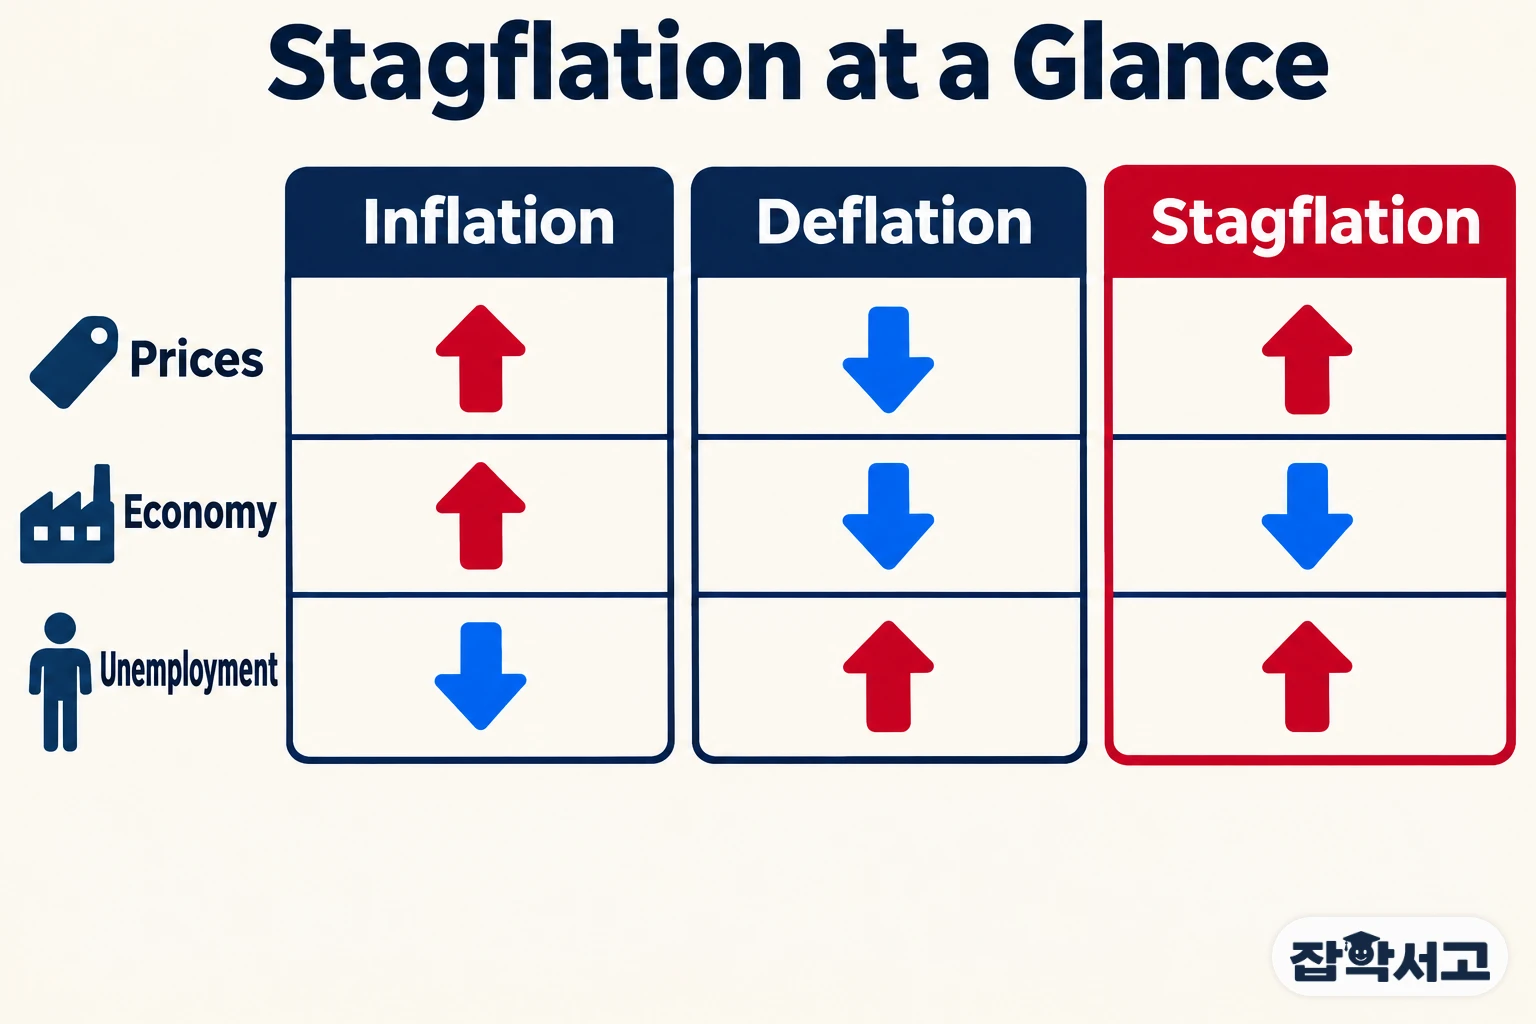
The table and infographic show the most common patterns; real economies can behave differently depending on the country and the period.
Telling them apart through real cases
Not every sharp rise in prices is stagflation. Here are three real cases to tell them apart.
The 1970s oil shocks: stagflation
When Arab oil producers cut exports in October 1973, the international oil price leapt within months from about $3 to nearly $12 a barrel. As prices soared in the United States and Europe, output fell and unemployment rose, and long lines of cars at gas stations became a familiar sight in America. The second oil shock after the 1979 Iranian Revolution pushed U.S. inflation to 13.5% in 1980, and South Korea, too, suffered negative growth and high inflation at the same time in 1980.
High prices in the U.S. in 2022: inflation
In June 2022, U.S. consumer price inflation hit 9.1%, the highest in about 40 years. It was the result of supply chain disruptions after COVID-19 combined with an energy price spike following Russia's invasion of Ukraine, and the media were full of stagflation warnings. Yet unemployment at the time was low, at around 3.5%, and companies were actually short of workers. Prices jumped, but no recession or mass unemployment came with them, so strictly speaking it was closer to high inflation than to stagflation.
Japan since the 1990s: deflation
After its stock and real estate bubbles burst in the early 1990s, Japan went through a long slump. Far from rising, prices began to edge down from the late 1990s. When prices fall, people put off spending in the hope that things will get even cheaper, which weighs on the economy again. A weak economy is something it shares with stagflation, but prices moved the other way, so it was deflation. The phrase "Lost Decade" comes from this period.
To sum up, there are two criteria: which way prices are moving, and what is happening to output and jobs in the meantime. When you come across the word stagflation in the news, start by checking whether growth and unemployment are worsening alongside the price figures.
Related reading