When the news says “economic growth this year is likely to come in lower than expected,” it is often followed by worries that “finding a job will get harder.” Why should jobs be the first thing to shrink when the economy grows just a little less? The rule of thumb that sums up this relationship between output and employment in simple numbers is “Okun’s Law.”
Simply put, Okun’s Law means “when economic growth falls below its usual pace, the unemployment rate rises, and when growth runs above its usual pace, the unemployment rate falls.” American economist Arthur Okun first presented it in 1962 in his paper “Potential GNP: Its Measurement and Significance,” delivered to the American Statistical Association. Okun later served as chairman of the Council of Economic Advisers under President Lyndon Johnson.
In this article, we will look in turn at the background of Okun’s Law, its two forms and key terms shown in a picture, how to read it with numbers, and finally its uses and limits.
An empirical rule linking output and unemployment: Okun’s Law
1. The background of Okun’s Law

In the early 1960s, the U.S. government wanted to know how far the economy was producing below what it was actually capable of. But “the amount produced when everything is used as fully as possible without strain” could not be observed directly. Okun found a way to estimate this gap using the unemployment rate published every month.
(1) The invisible potential output
The amount of output that can be achieved when labor and capital are all used without strain is called potential output. If actual output falls short of it, part of the economy is effectively sitting idle by that difference.
(2) The unemployment rate as a clue
When people who want to work cannot find jobs, it means there is unused productive capacity. Okun saw the unemployment rate as the easiest indicator of an output shortfall.
(3) What comes with one percentage point of unemployment
Okun explained that when unemployment falls, it is not only the number of people working that rises; labor force participation, hours worked per person, and output per hour increase as well. That is why a small change in the unemployment rate shows up as a larger change in output.
2. The two forms and key terms in a picture

Okun’s Law is usually expressed in two forms. One is the “gap version,” which links the difference between actual and potential output to the unemployment rate; the other is the “difference version,” which links each year’s growth rate to the change in the unemployment rate.
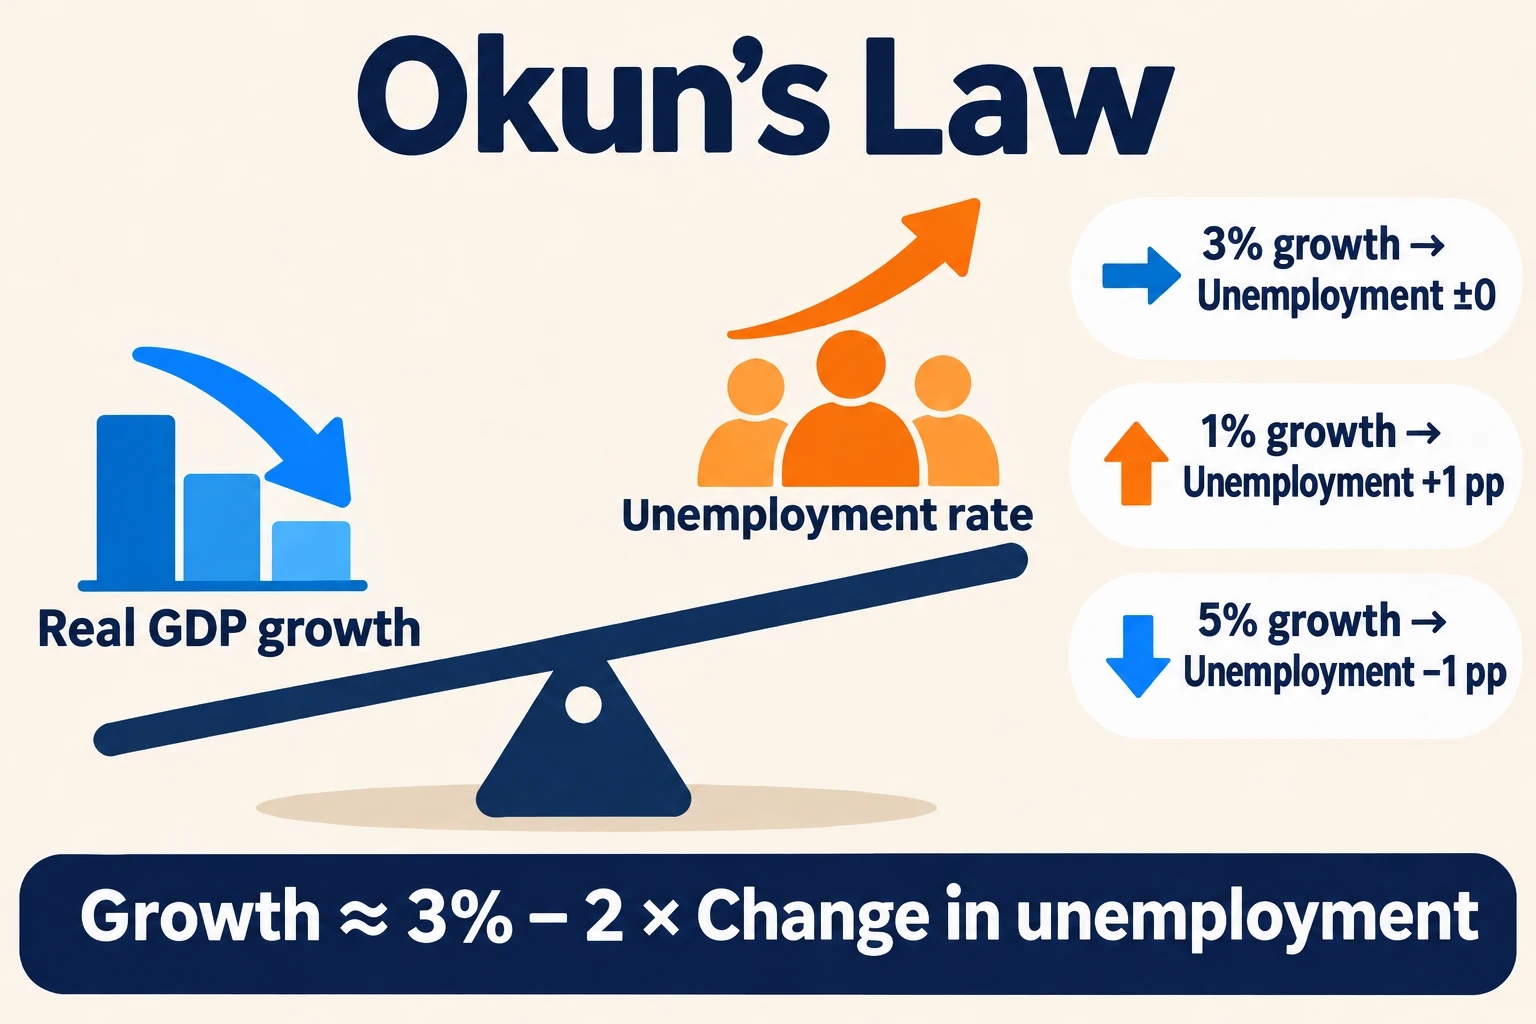
- Potential Output: The amount that can be produced when labor and capital are all used without strain.
- Output Gap: The difference between actual and potential output, expressed as a percentage.
- Natural Rate of Unemployment: The level of unemployment that remains even when the economy is in normal condition.
- Okun’s Coefficient: A number showing by how many percent output changes for a one-percentage-point change in the unemployment rate.
(1) The gap version
If the unemployment rate is one percentage point above the natural rate, actual output is considered about 2% below potential output. However, potential output and the natural rate can only be estimated, so this version is hard to use as it is.
(2) The difference version
With U.S. data, the formula “real GDP growth ≈ 3% − 2 × change in the unemployment rate” is often cited. Here, 3% is the average pace at which output at full employment grows.
(3) What the two forms share
Either way, they tell the same story: when output grows more slowly than usual, the unemployment rate rises, and when it grows faster, the unemployment rate falls.
3. Reading Okun’s Law with numbers

Using the formula above, we can roughly guess how the unemployment rate will move from a growth forecast alone. Let’s work through a few cases using values commonly used for U.S. data.
(1) Growing at the usual pace
If real GDP grows 3% in a year, the formula gives a change in the unemployment rate of zero. In other words, if the economy only grows at its usual pace, it barely absorbs the growing workforce and rising productivity, and the unemployment rate stays where it is.
(2) When growth stalls
If growth reaches only 1%, it is 2 percentage points short of the usual pace, so the unemployment rate can be expected to rise by about 1 percentage point. If growth is 0%, it rises by about 1.5 percentage points.
(3) To lower unemployment
Conversely, lowering the unemployment rate by 1 percentage point requires growth of about 5%, the usual 3% plus 2 percentage points. This is why simply “growing” is not enough for the economy to reduce unemployment.
4. Uses and limits of Okun’s Law

Okun’s Law is simple, but governments, central banks, and economic research institutes still refer to it often when diagnosing the economy. However, despite the name “law,” it does not always hold the way a law of physics does.
(1) Assessing the economy and policy
When a growth forecast comes out, it is used to gauge how much unemployment might rise and whether economic stimulus is needed. By showing the output lost to unemployment, it also helps explain the cost of a recession.
(2) A coefficient that differs by country and period
Okun’s coefficient varies from country to country and from era to era, because labor market institutions, employment practices, and industrial structures differ. Some analyses also show that the coefficient has become smaller over time in the United States.
(3) Jobless growth
During the U.S. recoveries of the early 1990s and early 2000s, the unemployment rate did not fall for some time even as output grew. When productivity rises quickly, firms can increase output without hiring more people; this is called “jobless growth.”
In the end, what Okun’s Law tells us is that when the economy grows less than usual, the burden shows up first in jobs. The simple idea that “jobs grow only when output grows enough” is the first step to understanding Okun’s Law.