If you gather the leading digits of numbers scattered around the world, such as the populations of countries, the lengths of rivers, or a company's transaction amounts, you might expect 1 through 9 to appear evenly. But when you actually count them, numbers starting with 1 are the most common, at about one in three, while numbers starting with 9 make up less than one in twenty. The concept that explains this surprising rule is 'Benford's Law.'
Simply put, Benford's Law refers to 'the phenomenon in which, across many naturally occurring sets of numerical data, smaller first digits appear more frequently.' The probability that the first digit is d is calculated as log₁₀(1+1/d), and according to this formula, 1 appears about 30.1% of the time, 2 about 17.6%, and 9 about 4.6%.
This article lays out Benford's Law in an easy-to-understand way, from its basic definition and the principle behind this distribution, to the data it fits and does not fit, and the fields where it is actually used, such as accounting audits, along with points to keep in mind.
Benford's Law: the rule hidden in the first digit
What Is Benford's Law?
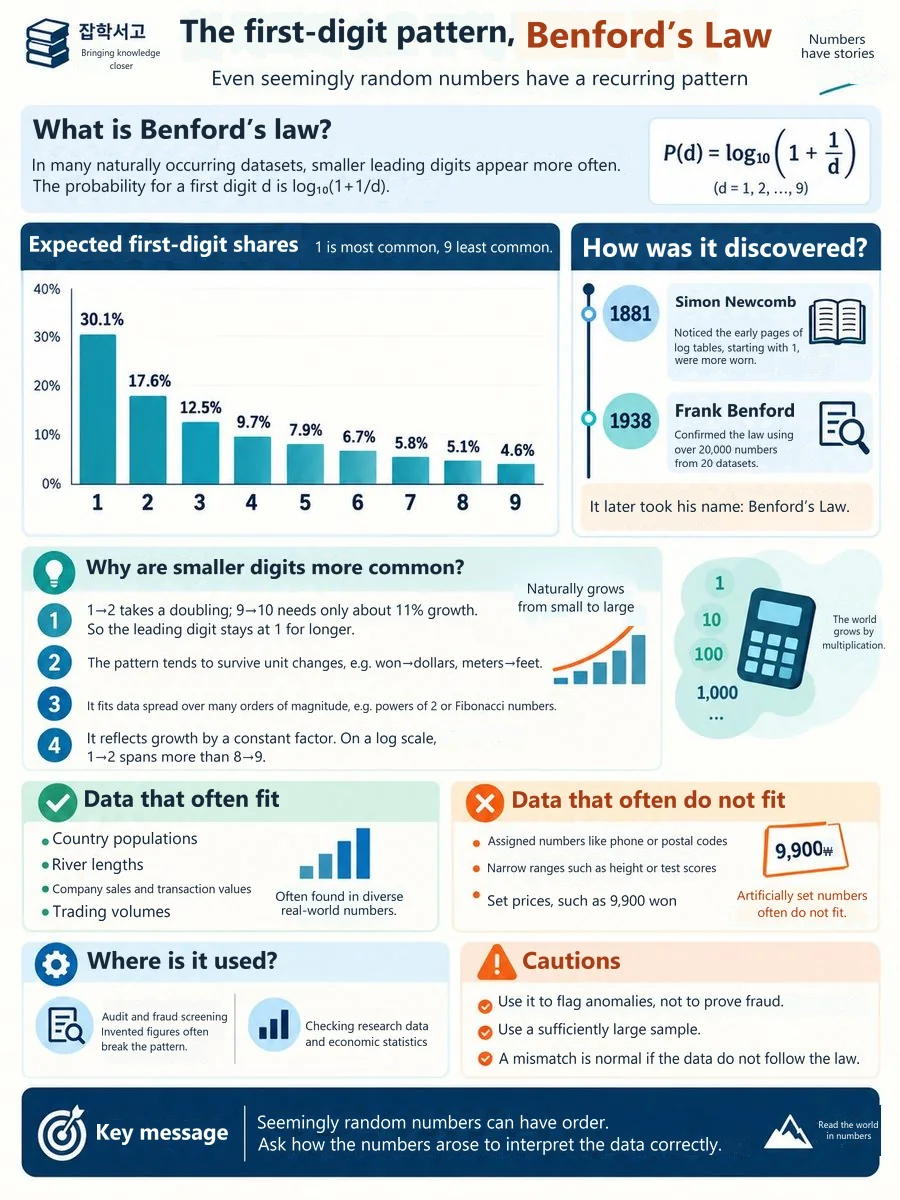

The first person to notice this rule was Simon Newcomb, a 19th-century American astronomer. In 1881, he noticed that in the books of logarithm tables used for calculations, the front pages listing numbers starting with 1 were far more worn than the back pages. It meant that people looked up numbers starting with 1 more often.
This observation was long forgotten until American physicist Frank Benford brought it up again in 1938. He collected more than 20,000 numbers from 20 unrelated data sets, including river drainage areas, city populations, physical constants, and numbers printed in newspapers, and confirmed the same tendency; the rule was later named after him. Because it was named after the person who popularized it rather than the one who discovered it first, it is sometimes cited in statistics as an irony of naming.
The expected proportions for each first digit are as follows.
- Digit 1 (One): appears most often, at about 30.1%.
- Digits 2–3 (Two to Three): about 17.6% and 12.5%, respectively.
- Digits 4–6 (Four to Six): about 9.7%, 7.9%, and 6.7%, respectively.
- Digits 7–9 (Seven to Nine): about 5.8%, 5.1%, and 4.6%, respectively, gradually decreasing.
Why Do Small Digits Come First So Often?

Benford's Law sounds strange at first, but it becomes natural once you picture how numbers grow.
(1) The road from 1 to 2 is the longest
Suppose a value starts at 100 and grows steadily. For its first digit to change from 1 to 2, it must go from 100 to 200, that is, it must double. By contrast, going from 900 to 1,000 requires an increase of only about 11%. That is why a growing value stays longest in the range where its first digit is 1.
(2) A distribution that holds even when units change
An important feature of the Benford distribution is that the first-digit distribution stays the same even if you convert prices from won to dollars or lengths from meters to feet. If the data's results do not depend on the unit, the first-digit distribution will follow this shape.
(3) Data spanning several orders of magnitude
The law fits better the more widely the values are spread across several orders of magnitude, for example from tens to millions. Sequences that grow at a constant ratio, such as powers of 2 or the Fibonacci sequence, also follow this distribution.
In summary, Benford's Law is a natural result in a world where numbers grow and shrink multiplicatively rather than additively, that is, at a constant ratio. On a logarithmic scale, the gap between 1 and 2 is much wider than the gap between 8 and 9, so more numbers fall into that wider interval.
Data That Fit the Law and Data That Do Not

Benford's Law is not a universal rule that works for every number. Depending on how the data were produced, it may fit well or not at all.
(1) Data that fit well
Data that arise naturally and vary greatly in size, such as countries' populations, river lengths, companies' revenues and transaction amounts, and stock trading volumes, generally come out close to the Benford distribution.
(2) Data that do not fit
Numbers assigned by people, such as phone numbers, postal codes, and resident registration numbers, have nothing to do with the law. Data concentrated in a narrow range, such as adults' heights or test scores out of 100, and data with a fixed upper or lower limit, do not fit either. The same goes for data containing many deliberately set prices, such as 9,900 won.
In the end, the key is to check, before applying the law, whether the data consist of naturally occurring numbers and whether they span several orders of magnitude.
Benford's Law in Accounting Audits

Benford's Law is used most actively in accounting audits and fraud detection. When people make up numbers, they tend to use 1 through 9 relatively evenly or to avoid certain digits. So if the first-digit distribution of a large number of transaction records deviates greatly from the Benford distribution, auditors treat that area as a candidate to examine first. Through research by accounting scholars such as Mark Nigrini since the 1990s, this method has become established as an analytical tool in audit practice.
The same principle is also applied to checking whether research data have been manipulated and to reviewing economic statistics. However, in fields where the nature of the data does not fit the law well, such as election results, there is much debate over interpretation, so care must be taken not to draw conclusions from the analysis results alone.
Here are some points worth remembering when using it.
- Benford analysis is not a tool that proves fraud but a screening tool that picks out points of suspicion. If a deviation appears, its cause must be checked separately.
- With a small sample, chance differences can look large. It is best to compare only after collecting a sufficiently large number of figures.
- If the numbers by their nature do not follow the law in the first place, a deviation in the distribution is not a warning sign but an expected result.
Benford's Law shows that order lies hidden even in numbers that seem random. Not stopping at the surface of numbers but also asking how they came about is the first step toward questioning data and reading it correctly.