
Data analysis plays an essential role in business and research. Insights gained through data analysis play an important role in optimizing decision-making, improving performance, and discovering new opportunities.
However, successful data analysis requires the ability to understand and use a variety of tools and techniques correctly. Among these, descriptive statistics is one of the most important tools that form the foundation of data analysis.
This material will explore descriptive statistics, a core tool for data analysis, in depth and discuss how to use it effectively.
Understanding the Importance of Essential Data Analysis Tools
The Goals of Data Analysis and the Importance of Tools
The primary goal of data analysis is to derive meaningful information from data and use it to solve problems or discover new opportunities. Interpreting data properly requires various tools and techniques for organizing, visualizing, and analyzing it. These tools play an important role in ensuring the reliability and accuracy of data. Choosing the wrong tools or using them incorrectly can lead to errors, which can negatively affect business decision-making.
The Role and Basic Concepts of Descriptive Statistics
Descriptive statistics is one of the most fundamental tools in data analysis and is used to identify and summarize the characteristics of data. It makes it easy to understand the overall distribution and variability of data. For example, the mean, median, and mode indicate the central tendency of data, while variance and standard deviation describe its variability. Gaining an overall picture of the data through descriptive statistics is therefore an essential part of data analysis.
Tools for Ensuring Data Reliability and Accuracy
The reliability and accuracy of data analysis depend on selecting appropriate tools and using them correctly. Using tools incorrectly can distort analysis results, creating a risk of poor decision-making. It is therefore important to select appropriate tools, and it is essential to understand exactly what role each tool plays in data analysis. In this way, the reliability of tools is an important factor in guaranteeing the results of data analysis.
Improving the Efficiency of Data Analysis Tools
When processing large datasets, efficiency is a very important factor in the analysis process. Using appropriate tools can shorten analysis time and automate complex tasks. For example, programming languages such as Python and R are suitable for processing and analyzing large amounts of data and can reduce much of the manual work involved. These tools greatly improve the efficiency of data analysis.
The Importance of Data Visualization
Another important aspect of data analysis is data visualization. Visualization makes complex data easier to understand and allows patterns and trends to be identified clearly. This makes decision-making more intuitive and helps people make decisions based on data. Data visualization plays an important role in the final stage of data analysis and makes data easier to communicate.
Understanding Essential Tools for Successful Data Analysis
The importance of essential tools in data analysis is evident in various aspects, including data reliability, analysis efficiency, and ease of visualization. Selecting and using these tools correctly is the key to successful data analysis. Using a variety of tools appropriately, including descriptive statistics, is essential to ensuring the accuracy and efficiency of data analysis.
Basic Concepts and Key Measures of Descriptive Statistics
The Definition and Role of Descriptive Statistics
Descriptive statistics is an important statistical technique used in the initial stages of data analysis. By summarizing complex data and identifying its basic characteristics, it makes the overall structure of the data easy to understand. Descriptive statistics allows data to be explained simply and clearly through key measures and is an essential tool for moving on to deeper analysis.
Central Tendency: Identifying the Center of Data
Central tendency is a measure that indicates a representative value of data and is used to identify its center. The main measures are the mean, median, and mode. The mean is calculated by adding all the values in a dataset and dividing the sum by the number of data points, and it represents a typical value for the entire dataset. The median is the value in the middle when the data is arranged in order of magnitude, and it reflects central tendency well even when the data is skewed. The mode is the value that appears most frequently in the data and provides important information about data frequency.
Variability: Measuring Data Dispersion
Variability indicates how widely data is scattered around the mean. The main measures are the range, variance, and standard deviation. The range is the difference between the maximum and minimum values in a dataset and shows the overall span of the data. Variance is calculated by squaring the average distance of each data point from the mean, while standard deviation is the square root of variance and is a representative measure that provides an intuitive understanding of how spread out the data distribution is. High variability means that the data values are widely spread, while low variability indicates that the data is concentrated around the mean.
Distribution: Understanding Data Patterns
Distribution is a concept that shows how data is spread overall. Common examples include the normal distribution, Poisson distribution, and uniform distribution. A normal distribution is symmetrical and bell-shaped and is commonly observed in nature and society. A Poisson distribution is used to represent the number of events occurring within a fixed period of time, while a uniform distribution gives all values the same probability. Understanding the distribution provides deeper insight into the characteristics of the data and makes it easier to discover specific patterns or outliers.
Skewness and Kurtosis: Analyzing Data Asymmetry and Tail Thickness
Skewness indicates how asymmetrical a data distribution is relative to the mean. Positive skewness indicates a distribution skewed to the right, while negative skewness indicates a distribution skewed to the left. Kurtosis indicates how thick the tails of a data distribution are: higher kurtosis means thicker tails, while lower kurtosis means thinner tails. Analyzing skewness and kurtosis provides a more accurate understanding of the shape of a data distribution and is useful for detecting unusual values or outliers.
Building a Foundation for Data Analysis
Descriptive statistics is the starting point for data analysis and an important tool for summarizing and understanding complex data. Key measures such as central tendency, variability, distribution, skewness, and kurtosis allow data to be analyzed from multiple perspectives, providing a basis for understanding its nature and moving on to more complex analysis. A sound understanding of the basic concepts of descriptive statistics enables better data-driven decision-making and improves the reliability and accuracy of analysis results.
How to Derive Data Insights Using Descriptive Statistics

The First Steps in Data Analysis Through Descriptive Statistics
Data analysis using descriptive statistics begins with identifying the basic characteristics of data after it has been collected and organized. To understand data accurately, it is essential to first analyze key measures such as central tendency, variability, and distribution. This process plays an important role in identifying overall trends in the data and efficiently summarizing it to derive insights.
Central Tendency Analysis: Identifying Representative Data Values
Central tendency analysis is the stage of identifying values that represent the data. The mean, median, and mode each describe the center of the data in a different way. For example, calculating customers' average purchase amount reveals how much most customers spend, while the median represents the middle value of the data because it is not affected by extreme values. Analyzing the mode identifies the most frequently occurring value, revealing the frequency of the data. By identifying the central characteristics of data through this process, important decisions can be made.
Variability Analysis: Assessing Data Dispersion and Consistency
Variability analysis is an important method for measuring how widely data is spread around the mean. A large standard deviation means that the data is widely distributed around the mean and that individual values show substantial variability. Conversely, a small standard deviation indicates that the data is concentrated around the mean, reflecting its consistency. Understanding variability is essential when building predictive models and provides important information for assessing the stability of data.
Data Distribution Analysis: Visual Understanding Through Histograms and Box Plots
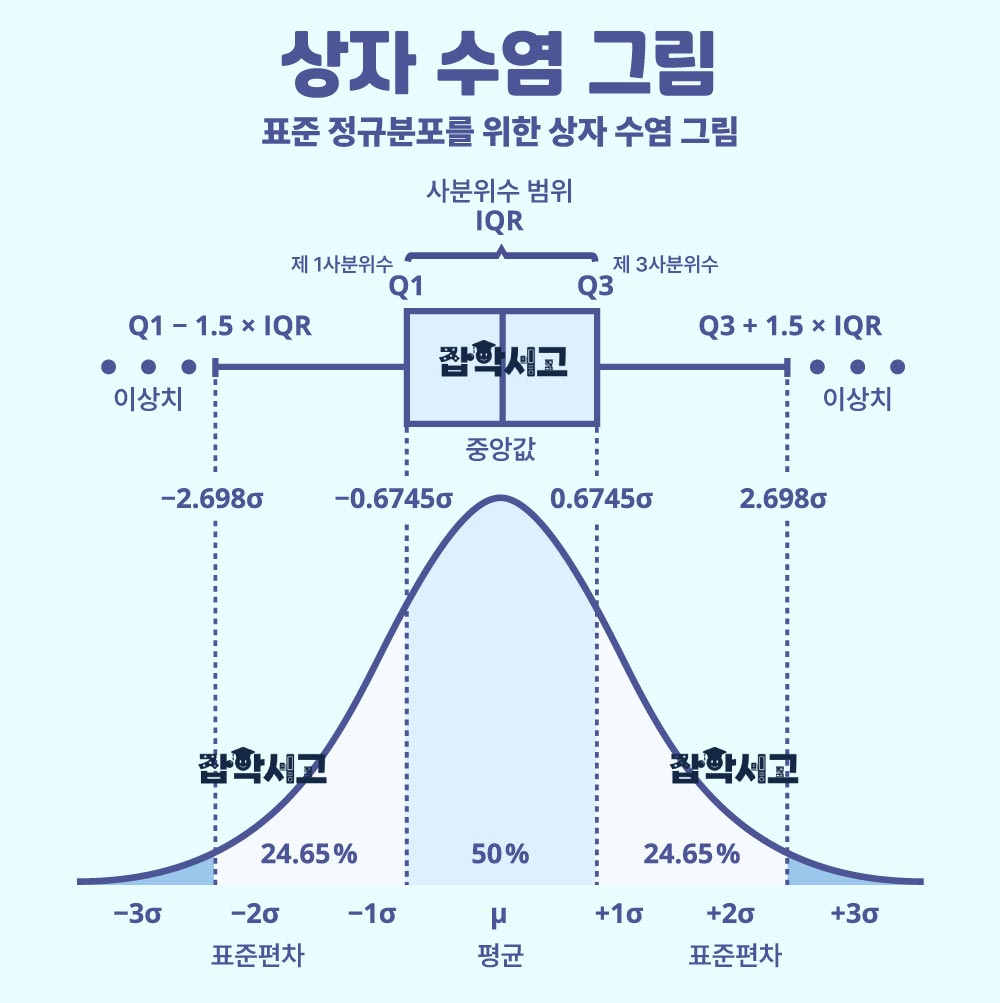
Visually analyzing the distribution of data greatly helps in understanding it. Visualization tools such as histograms and box plots (box plot) make it easy to see how data is spread, whether it follows a normal distribution, or whether it is asymmetrical. This provides an intuitive understanding of the characteristics of data and helps identify outliers or asymmetry in its distribution.
Identifying Missing Values and Outliers: Improving Data Quality
Missing values (missing values) and outliers (outliers) are important elements in data analysis. Missing values can undermine the completeness of data, and failing to address them can negatively affect analysis results. Outliers are values that deviate from data patterns and can distort analysis results. Data quality can be improved by handling missing values appropriately and analyzing outliers, removing them when necessary.
Correlation Analysis: Understanding Relationships Between Variables
Correlation (correlation) analysis is used to identify the relationship between two variables. A higher correlation coefficient indicates a stronger association between the variables, which can be used to improve the reliability of predictive models. Correlation analysis plays an important role, particularly when testing hypotheses or building predictive models.
Communicating Results Through Visualization: Providing Clear Information
Results from analysis using descriptive statistics can be communicated clearly through visualization tools. Presenting analysis results visually using bar charts, line charts, and pie charts to make complex data easier to understand provides decision-makers with clearer and more intuitive information. Visualization serves as an important tool for effectively communicating data analysis results.
The Importance of Data Insights Through Descriptive Statistics
Analyzing central tendency, variability, distribution, missing values, outliers, and correlations through descriptive statistics enables a deep understanding of data. Insights derived from this analysis play an essential role in making important decisions or building predictive models. In addition, clearly communicating complex information through visualization tools can improve the efficiency of data-driven decision-making.
Applying Descriptive Statistics in Practice

Data Collection and Preprocessing: The Start of Analysis
The first step in applying descriptive statistics is to collect and preprocess data. For example, an online store can collect data such as customer IDs, purchase dates, purchase amounts, and products purchased. After collecting data, its quality must be checked, and missing values or errors must be addressed. Preprocessing, which involves organizing data into consistent formats and handling outliers or missing values, provides the foundation for successful analysis.
Central Tendency Analysis: Identifying Customer Spending Patterns
Next, descriptive statistics can be used to analyze the central tendency of the data. Calculate the mean, median, and mode of purchase amounts to determine how much customers spend on average. For example, if customers' average purchase amount is 50,000 won, most customers can be considered to spend around this amount. Identifying the middle value through the median also provides insights that are not affected by extreme values. The mode indicates the most frequently occurring amount and reveals major spending patterns.
Variability Analysis: Understanding the Diversity of Purchasing Patterns
Variability analysis is essential to understanding how much customers' spending amounts vary. Standard deviation can be used to determine how widely purchase amounts are spread around the mean. A large standard deviation indicates substantial differences in customers' spending amounts and may signal that some customers are spending large amounts. This allows the diversity of purchasing patterns to be analyzed and provides important information for developing marketing strategies.
Visualizing Data Distributions: Insights Through Histograms
Analyzing the distribution of purchase amounts using visualization tools such as histograms makes it easy to determine whether the data follows a normal distribution or has an asymmetrical distribution. For example, if some customers spend large amounts, the histogram will show a distribution with a long right tail. This visualization provides a more intuitive understanding of the overall distribution of data and helps develop marketing strategies targeting high-spending customers.
Handling Outliers and Missing Values: Improving Data Quality
Handling outliers and missing values is an important process for improving the accuracy of analysis. Outliers are values that deviate from the overall pattern of the data and need to be removed or analyzed separately. For example, if some customers' purchase amounts are unusually high, the data can be investigated to determine whether this is due to special events or promotions. Since missing values can affect analysis results, appropriate methods for handling them must be developed.
Correlation Analysis: Identifying Relationships Between Variables
Analyzing the correlation between purchase amount and purchase frequency reveals the relationship between these variables. A high correlation coefficient means that customers who purchase more frequently tend to spend more. This can be used to identify frequent customers and develop personalized marketing strategies for VIP customers. Correlation analysis plays a very important role in data-driven decision-making.
The Benefits of Using Descriptive Statistics in Practice
Using descriptive statistics in real-world data analysis enables data to be summarized and analyzed effectively, allowing meaningful insights to be derived. These insights play an important role in improving business performance and making data-driven decisions. Descriptive statistics offers considerable practical value for gaining a deep understanding of customer behavior and developing personalized strategies.
Descriptive statistics is an important tool that forms the foundation of data analysis. It enables meaningful insights to be derived by understanding the basic characteristics of data, analyzing variability and distribution, and identifying correlations.
This process is essential to data-driven decision-making, and understanding descriptive statistics accurately and using it appropriately will help improve the accuracy and efficiency of data analysis. This will ultimately play an important role in improving business performance.