
In this article, we will explore the concept of norms. Norms refer to the scores used as a basis for comparison when comparing an individual's test score with those of other people, making it easy to identify the individual's relative position within a group.
Norm scores are often also called z-scores and indicate how far a particular data point is from the mean. This article will examine the 3 types of within-group norms used here.
What Are Within-Group Norms?
 A test administered before score data are obtained
Within-group norms make it easy to compare an individual's raw score with a norm group; whereas raw scores can provide information at roughly the ordinal-scale level, norm scores are assigned after conversion to give them the properties of an interval scale.
Note: Nominal scale < ordinal scale < interval scale < ratio scale
These norm scores (within-group norms) include percentile scores, standard scores, and stanines. Since an explanation in words alone can become complicated, illustrations have also been prepared. Let's examine each type of score in turn.
1. Percentile Scores
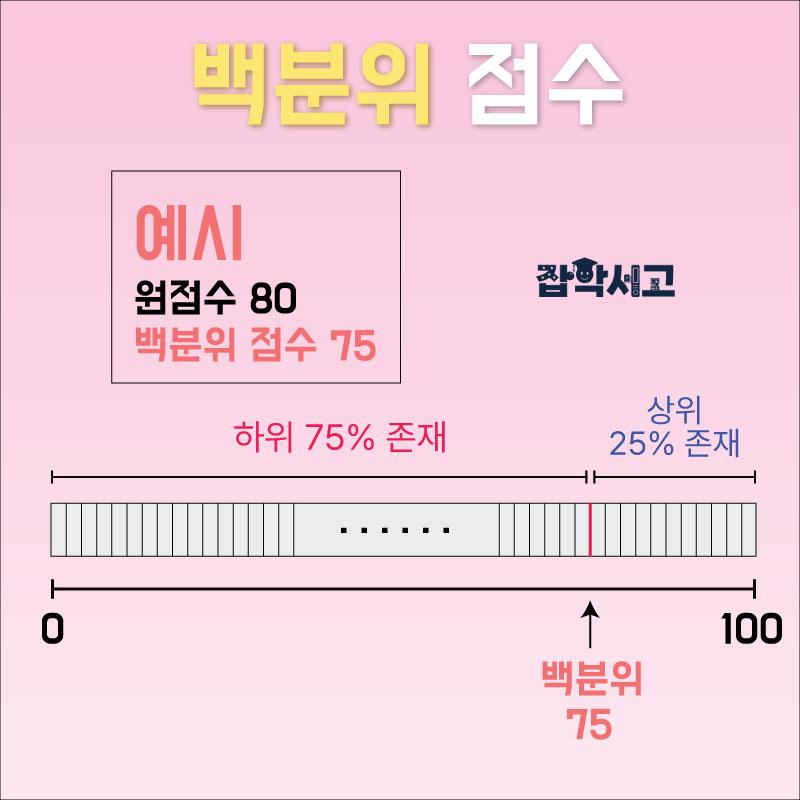 Conceptual diagram of percentile scores
A percentile score is a converted score assigned after distributing raw scores across 100 equal intervals and indicates an individual's position within a particular group. Because its meaning is simple and familiar, it makes an individual's relative position easiest to understand.
As in the example in the image above, if the raw score is 80 points and the percentile score is 75, then 75% of people are below that individual and 25% are above. In other words, the score in this example falls within the top 25%.
2. Standard Scores
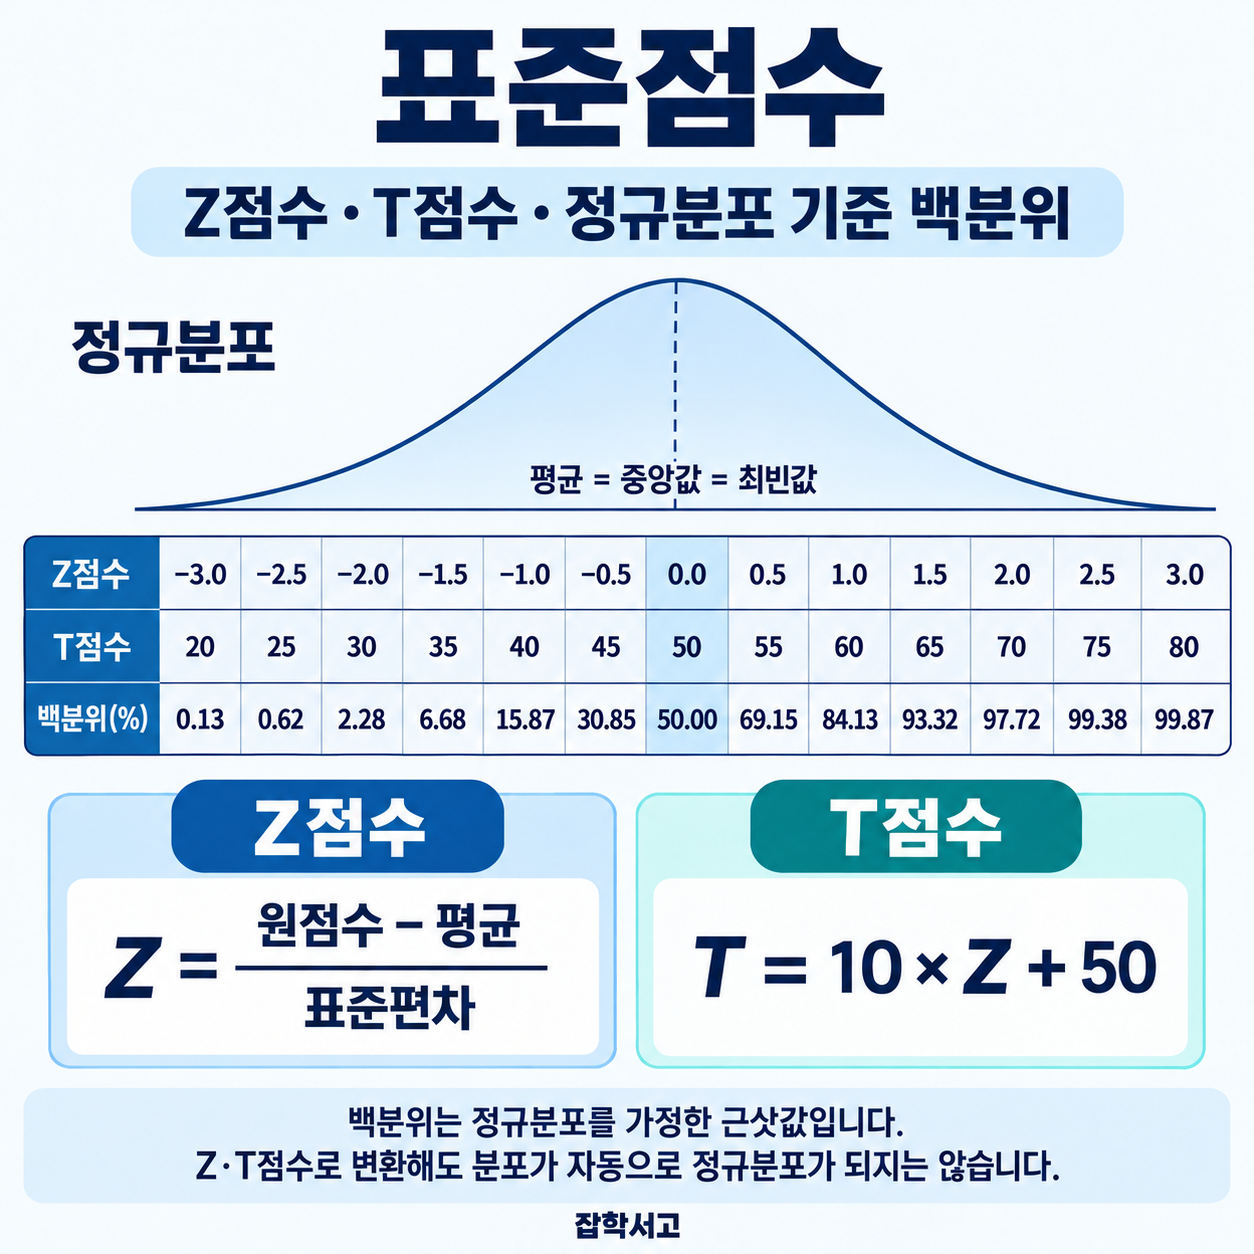 Conceptual diagram of standard scores (Z-scores and T-scores)
A standard score indicates a position within a distribution using standard deviation units centered on the target group's mean. It shows the distance of an individual's score from the mean and is divided into Z-scores and T-scores. The relevant formulas are shown in the image above.
A Z-score is a score obtained by converting a raw score to a number with a mean of 0 and a standard deviation of 1, while a T-score is obtained by converting the score to a distribution with a mean of 50 and a standard deviation of 10 to compensate for Z-scores with negative (-) values.
3. Stanines
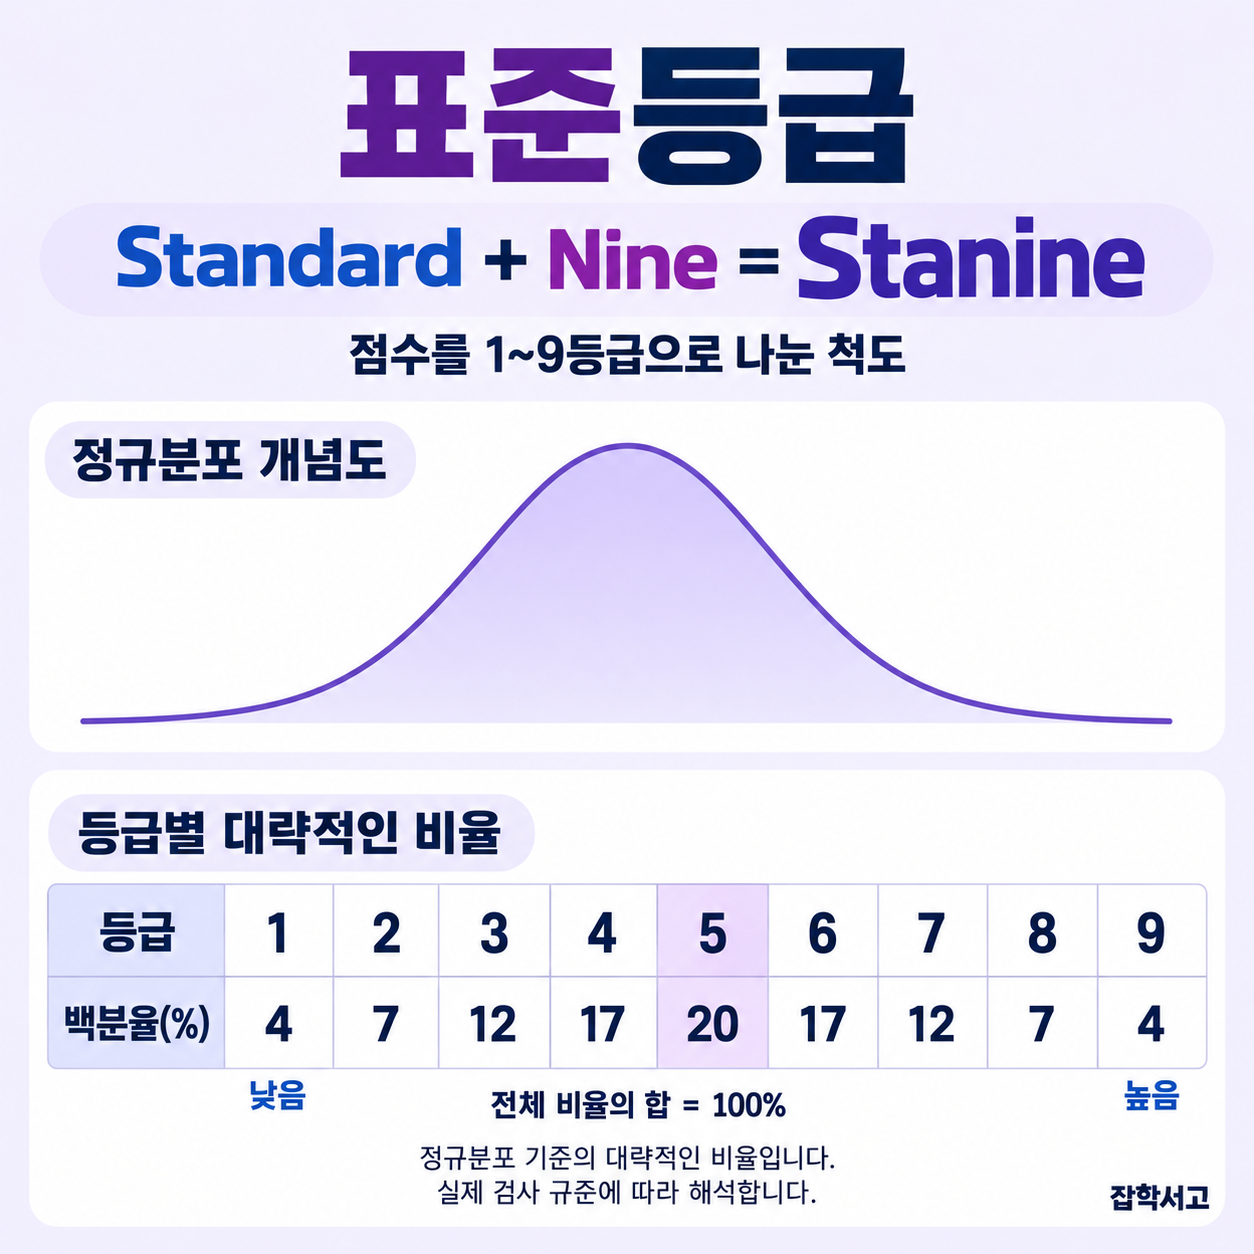 Conceptual diagram of stanines
Stanines take their name from a combination of 'Standard' and 'Nine' and are also known as the Stanine scale. All raw scores are categorized into grades from 1 to 9, and each is assigned to its corresponding interval.
A common example in everyday life is placing a student who has taken a test and received a certain score into a grade category, such as College Scholastic Ability Test grades (1–9) or university grades (A–D). This grading system helps prevent overinterpretation when small score differences of around 1–3 points lead to joy for some students and disappointment for others.
We have now examined the 3 types of within-group norms used in standardized psychological tests. This information is part of statistical knowledge and can be useful time and again if you keep it in mind.
In addition to within-group norms, there are also developmental norms, which give meaning to raw scores by indicating how far the person being tested has progressed along a developmental path.
These include age norms, in which test items are organized into scales by age level; grade norms, which use means or medians for each school grade; ordinal norms, which identify a person's position within the stages of development by observing behavior; and longitudinal norms, which track each individual's patterns of physical and mental development and display them as developmental curves.
It would be helpful to learn about developmental norms as well as the within-group norms introduced in this article. Although this article is based on within-group norms in statistics, its contents may also help people who need other statistical knowledge, so it is useful to keep it for reference.