Data analysis has become an important tool in the modern business environment. In particular, data correlation analysis plays a key role in understanding relationships among multiple variables. It enables us to discover patterns hidden within data and make better decisions.
This material will begin with the basic concepts of data correlation analysis and explore in depth the types of correlation coefficients, how to apply them in practice, and how to interpret the results.
Understanding the Basic Concepts and Importance of Data Correlation Analysis

What Is Data Correlation Analysis?
Data correlation analysis is a statistical technique for analyzing relationships between two or more variables. This technique allows us to identify how variables are related to one another and the direction in which they interact. In particular, correlation analysis quantifies how strongly variables are connected. For example, a correlation in which ice cream sales increase as temperatures rise can reveal a pattern between temperature and sales. This kind of analysis plays a very important role in developing business strategies.
The Importance of Correlation Analysis and Its Role in Decision-Making
The central importance of correlation analysis lies in its ability to enable data-driven decision-making. By analyzing correlations between variables, companies can make effective decisions in various areas, including marketing strategies, improvements in operational efficiency, and predictions of customer behavior. Although correlation analysis does not directly prove causation, it greatly helps us understand associations between variables and contributes to developing more reliable strategies.
Practical Applications of Correlation Analysis
Correlation analysis is also a tool frequently used in data exploration. Finding important patterns in large datasets is not easy. Correlation analysis serves as a very useful tool for identifying how variables interact during this exploration process. For example, by analyzing the correlation between customer satisfaction and repurchase intention, companies can gain the strategic insights needed to increase customer loyalty.
Interpreting Correlation Coefficients and Their Limitations
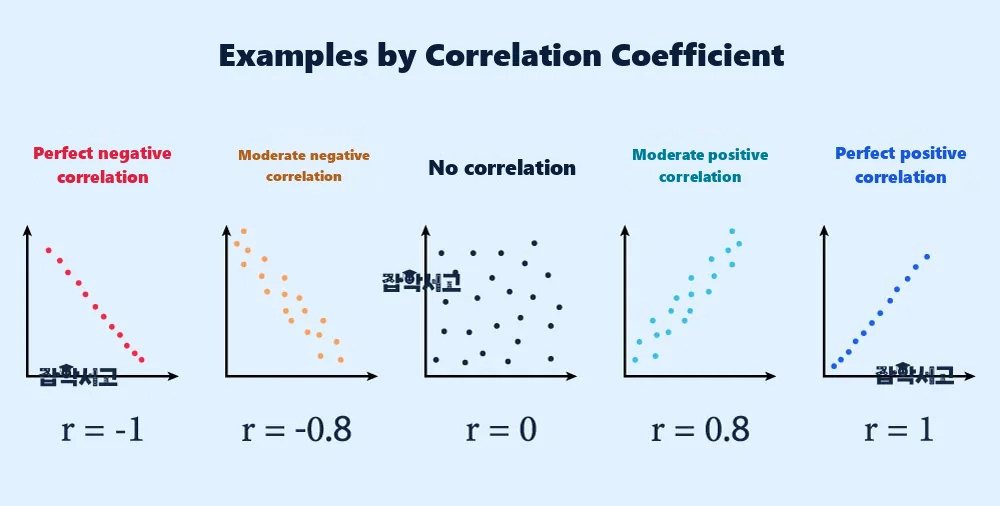
The most important measure in correlation analysis is the correlation coefficient. A correlation coefficient is a numerical value that expresses how strong the relationship between two variables is and its direction. Correlation coefficients range from -1 to 1, with values closer to 1 indicating a positive correlation and values closer to -1 indicating a negative correlation. However, correlation analysis indicates only the direction and strength of a relationship and is not a tool for proving causation, so this must be kept in mind when interpreting the results.
Potential Errors and Precautions in Correlation Analysis
Overusing or misinterpreting correlation analysis carries the risk of reaching incorrect conclusions. In particular, making decisions based solely on correlation coefficients increases the likelihood of misjudgment. This is because the existence of a correlation does not necessarily mean that a causal relationship exists. When applying correlation analysis, it is necessary to proceed carefully after fully understanding the characteristics of the variables to be analyzed, the quality of the data, and the purpose of the analysis.
Analyzing Different Types of Correlation Coefficients and Examples of Their Use
Pearson Correlation Coefficient: Measuring Relationships Between Continuous Variables
The Pearson correlation coefficient is the most widely used correlation coefficient and measures the linear relationship between two continuous variables. The Pearson correlation coefficient ranges from -1 to 1, with values closer to 1 indicating a strong positive correlation and values closer to -1 indicating a strong negative correlation. A value close to 0 means there is no correlation. For example, when analyzing the relationship between age and income, the Pearson correlation coefficient can be used to easily identify the correlation between them. The Pearson correlation coefficient is useful for identifying linear relationships between two variables but is not suitable for nonlinear relationships.
The Process of Calculating the Pearson Correlation Coefficient
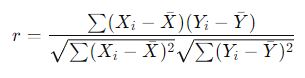
To calculate the Pearson correlation coefficient, first subtract the mean from each variable's values, multiply these values together, and then add all the resulting values. This is called covariance and represents the joint variability of the two variables. Next, divide the covariance by the product of the standard deviations of the two variables to calculate the Pearson correlation coefficient. The value ranges from -1 to 1, with values closer to 1 indicating a strong positive correlation and values closer to -1 indicating a strong negative correlation.
Spearman Rank Correlation Coefficient: Analyzing Nonlinear Relationships
The Spearman rank correlation coefficient is a technique that measures relationships between variables based on ranks. It is useful for assessing nonlinear relationships and is effective when data are not continuous or when order matters. Whereas the Pearson correlation coefficient focuses on linear relationships, the Spearman rank correlation coefficient can identify nonlinear relationships between two variables. For example, the relationship between social status and personal happiness may not be linear, but the Spearman rank correlation coefficient can be used to clearly analyze this nonlinear relationship.
How to Calculate the Spearman Rank Correlation Coefficient
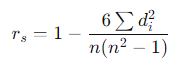
The Spearman rank correlation coefficient is calculated based on the rank of each data value rather than the data values themselves. First, assign a rank to each data value and then calculate the squared differences between the ranks of the two variables. Next, divide the squared rank differences by the total number of data points to calculate the Spearman correlation coefficient. The Spearman correlation coefficient is a powerful tool for identifying nonlinear relationships between variables.
Kendall's Tau Correlation Coefficient: Assessing Rank Consistency
Kendall's tau correlation coefficient is a method for measuring the consistency of ranks between two variables. It is similar to the Spearman rank correlation coefficient but can provide more reliable results. It is particularly useful when the dataset is small or tied ranks occur frequently. Kendall's tau considers the number of discordant pairs to analyze how consistently the ranks of variables are ordered. For example, when assessing relationships between variables in a small dataset, Kendall's tau correlation coefficient can produce more accurate results.
How Kendall's Tau Correlation Coefficient Is Calculated
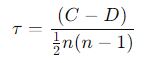
Kendall's tau correlation coefficient focuses on checking whether the ordering of data pairs is consistent. During the calculation, data pairs across the two variables are compared to count the number of 'concordant pairs' and 'discordant pairs,' and the correlation coefficient is then calculated based on these values. Kendall's tau is advantageous when there are few data points or many tied ranks and is effective in increasing the reliability of rank relationships.
Examples of Using Correlation Coefficients in Practice
In practice, business problems can be solved by appropriately using different correlation coefficients. For example, when assessing customer loyalty based on customer satisfaction survey results, the Spearman rank correlation coefficient makes it easy to identify nonlinear relationships. In addition, using the Pearson correlation coefficient to analyze the linear relationship between product sales and advertising costs can provide important information for developing marketing strategies. Each correlation coefficient can provide better insights in particular situations, so it is important to choose an appropriate correlation coefficient according to the nature of the problem and the characteristics of the data.
Applications of Correlation Coefficients in Academic Fields
Correlation coefficients are widely used not only in business but also in various academic fields, including economics, sociology, and psychology. In economics, investment strategies can be developed by analyzing correlations between stock market volatility and economic indicators. In sociology, correlation coefficients contribute to measuring and explaining relationships between individuals through social network analysis. In psychology, correlation coefficients are used to analyze relationships between human behavior and specific variables, supporting research findings.
The Importance of Choosing an Appropriate Correlation Coefficient
The choice of correlation coefficient should depend on the characteristics of the data and the purpose of the analysis. Because each correlation coefficient can produce more meaningful results in particular situations, choosing an appropriate coefficient is important. The Pearson correlation coefficient is suitable for analyzing linear relationships in continuous data, but the Spearman rank correlation coefficient or Kendall's tau correlation coefficient may be more advantageous for nonlinear relationships or rank-based data. Choosing an appropriate correlation coefficient can improve the accuracy of the analysis and provide a basis for developing practical insights and strategies.
How to Apply Correlation Analysis Effectively in Practice

Choosing a Correlation Coefficient Based on Data Characteristics
To apply correlation analysis effectively in practice, you must first clearly understand the characteristics of the data you intend to analyze. It is important to choose a correlation coefficient based on whether the variables are continuous or non-continuous. For example, the Pearson correlation coefficient is suitable for analyzing relationships between continuous variables, while the Spearman correlation coefficient is advantageous for analyzing ranked data or nonlinear relationships. Choosing an appropriate correlation coefficient can improve the accuracy of the analysis results.
The Importance of Data Preprocessing
Data preprocessing is essential before conducting correlation analysis. Handling missing values and removing outliers are necessary to increase the reliability of correlation analysis. Outliers can have a substantial effect on correlation coefficients and are highly likely to compromise the accuracy of the analysis. It is therefore important to prevent distorted results by identifying outliers and removing or appropriately handling them. Thorough preprocessing makes more accurate correlation analysis possible.
Distinguishing Correlation from Causation
Correlation analysis is useful for understanding relationships between variables, but correlation does not itself imply causation. In other words, even a high correlation between two variables does not mean that they have a cause-and-effect relationship. Therefore, making decisions based solely on correlation analysis results can be risky, and other analytical techniques need to be used alongside it to clearly establish causation. For example, using regression analysis together with correlation analysis can provide clearer insights into causal relationships.
Visualizing Correlation Analysis Results
Using visualization tools is important for communicating correlation analysis results effectively in practice. Scatter plots, heatmaps, and similar tools are useful for intuitively understanding relationships between variables, and visually representing complex data makes the analysis results easier to explain. This allows the results to be communicated clearly to team members or management and supports strategic decision-making.
Strategic Decision-Making Using Correlation Analysis
Correlation analysis serves as an important tool for making strategic decisions in practice. For example, a marketing team can use correlation analysis to analyze the relationship between the effectiveness of advertising campaigns and increases in sales, then adjust its marketing strategy accordingly. In this way, correlation analysis contributes to strategy development by providing meaningful insights during data-driven decision-making.
Continuously Monitoring Correlation Analysis Results
Insights obtained through correlation analysis can change over time, making continuous monitoring and feedback necessary. Data can change from moment to moment, and correlations can change accordingly. It is therefore important to maintain up-to-date insights through regular data updates and analysis and to incorporate those insights in real time. This process can continuously ensure the effectiveness of data-driven strategies.
Interpreting Correlation Analysis Results and Making Data-Driven Decisions

The Magnitude and Direction of Correlation Coefficients: Understanding Relationships Between Variables
In correlation analysis results, correlation coefficients quantify the relationships between variables. The magnitude and direction of a correlation coefficient indicate the strength and type of relationship between variables, providing a basis for understanding patterns and trends in the data. The closer the correlation coefficient is to 1, the stronger the positive correlation between the two variables; the closer it is to -1, the stronger the negative correlation. On the other hand, a correlation coefficient close to 0 means that there is almost no relationship between the variables, and other analytical methods may need to be considered.
Examining Statistical Significance: Ensuring Reliability
A high correlation coefficient does not necessarily indicate a meaningful relationship. When interpreting correlation analysis, it is essential to check the statistical significance of the correlation coefficient. The p-value should be examined to determine whether the correlation coefficient is statistically significant, allowing you to verify whether the correlation arose from errors or noise. A significant correlation provides a reliable foundation for data-driven decision-making.
Data-Driven Decision-Making Using Correlation Analysis Results
Correlation analysis is an important tool for supporting data-driven decision-making. For example, identifying specific patterns in customer behavior data can provide a basis for developing targeted marketing strategies. Understanding correlations between variables makes it possible to identify customer preferences and behavioral patterns and offer more personalized services. This kind of analysis can contribute to improving customer loyalty and business growth.
The Limitations of Correlation Analysis and the Need to Establish Causation
Although correlation analysis is a useful tool, it has limitations because correlation does not guarantee causation. A correlation coefficient alone cannot clearly establish whether the relationship between variables is merely an association or a causal relationship. Therefore, additional analysis, such as time-series analysis and experimental research designs, is needed to establish causation. This makes more accurate decision-making possible.
The Importance of Up-to-Date Data
Decisions made using correlation analysis must be based on up-to-date data and its accuracy. Outdated data or data containing errors can distort correlation analysis results, and decisions based on those results can negatively affect a business. It is therefore important to maintain accuracy during data collection and continuously update the data, thereby improving the reliability of correlation analysis results.
Interpretation and Application Suited to the Business Context
It is important to interpret and apply correlation analysis results in accordance with the business context. Rather than merely referring to correlation coefficients, data should be used in ways that align with the organization's goals and strategies. By providing a data-based foundation for the decision-making process, correlation analysis enables the development of more innovative and effective strategies. Appropriately applying correlation analysis results to the business environment can lead to better decisions.
Data correlation analysis has become an essential analytical tool in the modern business environment for understanding complex data structures and exploring relationships between variables. Through this analysis, we can make strategic decisions more effectively.
By understanding the various techniques of correlation analysis and how to use them in practice, we can derive data-driven insights and incorporate them into business strategies. We hope that the insights gained through data correlation analysis can contribute to making innovative and efficient decisions.