
Suppose a hospital finds that treatment A works better than B across all patients, but when you split them into mild and severe cases, B works better in both. Which treatment would you choose? This strange phenomenon, in which numbers flip when they are “combined,” shows up again and again in data interpretation. It is called “Simpson’s Paradox.”
Put simply, Simpson’s paradox refers to “a phenomenon in which a relationship in a consistent direction appears when several groups are viewed separately, but weakens or even reverses into the opposite direction when those groups are combined.” Edward H. Simpson described it in 1951, and even earlier, Karl Pearson in 1899 and Udny Yule in 1903 mentioned similar cases.
In this article, we lay out Simpson’s paradox in an easy-to-understand way, from its definition and how it arises to representative real-world cases and checkpoints that keep you from falling into it when reading data.
The structure of Simpson’s paradox and principles for interpreting it
What is Simpson’s paradox?
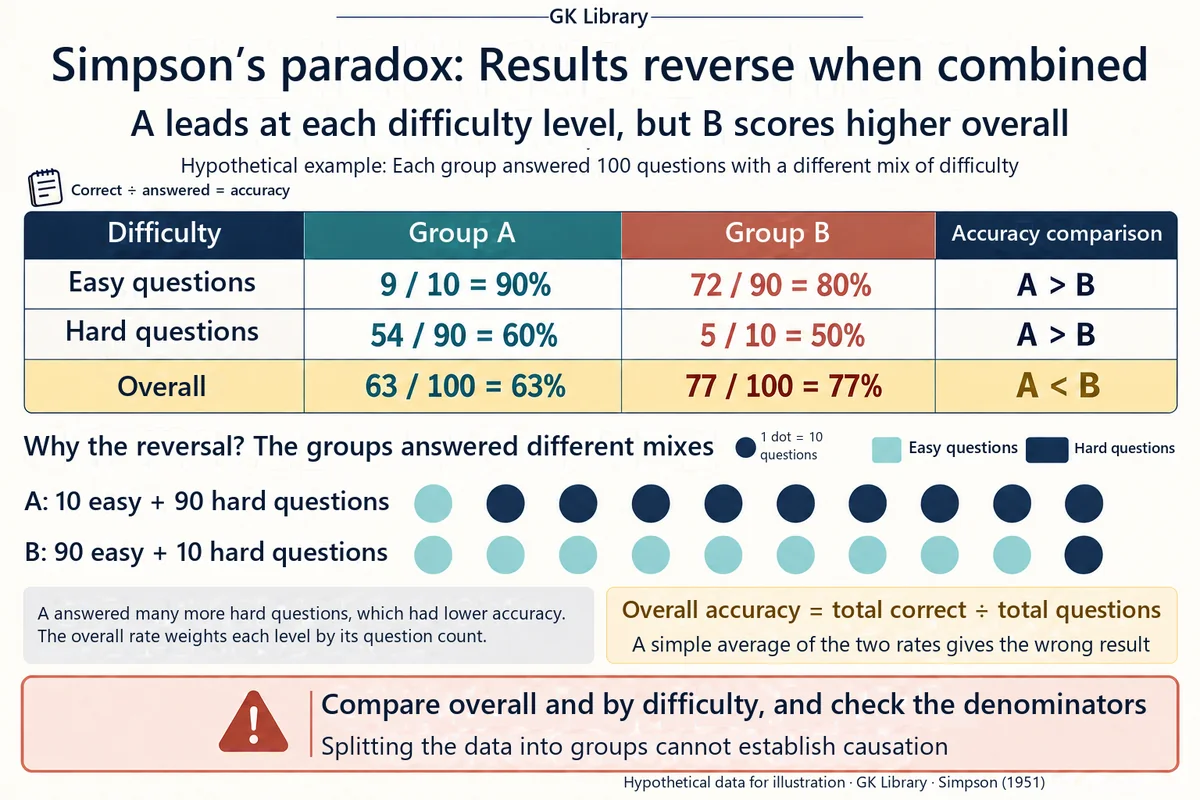

Simpson’s paradox is not a simple calculation mistake. It occurs when “the sum of the parts” and “the whole” disagree—for example, when A has a higher success rate than B within each group, yet B comes out with the higher success rate once everything is combined. Intuition easily tells us that “if you win in every piece, you should win overall,” but that intuition can break the moment ratios are combined.
Why does this happen? The key is that the sample size and composition differ from group to group. For example, if treatment A was used mostly on severe patients and treatment B mostly on mild patients, A’s overall success rate gets dragged down by the share of severe cases, while B’s gets pulled up by the share of mild cases. Even if A wins in each group, the combined picture shows B winning.
- Within-group trend: the direction of the relationship seen inside each subgroup.
- Aggregate trend: the direction of the relationship seen after the subgroups are combined.
- Paradox: the state in which the two directions disagree or are opposite.
Why the numbers flip: the role of confounding variables

In statistics, this phenomenon is understood to have a “confounding variable” or “lurking variable” behind it. This is the case where a third variable simultaneously disturbs the relationship between the two variables of interest.
(1) Imbalance in group sizes
When samples are concentrated in one group, that group’s results are overrepresented in the whole. Even if a small group shows a clear effect, the opposite effect in a large group can dominate the total.
(2) Treatment and conditions changing together
If treatments are not randomly assigned to difficult and easy patients, “the effect of the treatment” and “the patient’s condition” become mixed up. In that case, looking only at the combined table makes it easy to mistakenly think the treatment itself is bad or good.
(3) Weighted averages of ratios
A success rate is not a simple average but an average weighted by the number of people. When the weights differ across groups, the wins and losses within each group can differ from the overall win or loss.
Put simply, Simpson’s paradox is a warning light showing that “which layers you split the data into” can change the conclusion.
Simpson’s paradox through simple examples

One of the most frequently cited cases is a comparison of kidney stone treatments. Looking only at the totals, one of surgical and non-surgical treatment appears superior, but a pattern was reported in which the advantage reverses when cases are split into small stones and large stones. Leave out “for whom, and under what conditions,” and the treatment scorecard becomes distorted.
Baseball batting averages can be explained with a similar structure. There are cases where player A had a higher batting average than player B in both the first and second halves of the season, yet B’s average is higher for the season as a whole. This is because the innings played and number of at-bats differ greatly from period to period. In other words, “the winner in each period” and “the winner for the season” can be different, which illustrates well the illusion that arises when you read a scorecard as a single line.
Similar reasoning is used in debates over university admission rates. Looking only at the overall admission rate, the gender gap seems large, but when broken down by department, the gap sometimes disappears or shrinks. The key here is not to jump straight to the conclusion that “there is no discrimination,” but to ask which layer (department, number of applicants, competition ratio) dominated the whole.
[Key points from the cases]
- Don’t trust only the totals table; split it again into meaningful subgroups.
- Note the size (weight) of each subgroup alongside it.
- Separately explain “why people were concentrated in that group.”
Four habits that keep you from falling into the trap when reading data

There is no formula that completely “eliminates” Simpson’s paradox. Instead, changing your habits of interpretation can greatly reduce the chance of falling into the trap.
(1) Decide the layers first
Write down in advance the variables that could affect the results, such as gender, age, severity, region, or product line, and look at the totals and the layer-by-layer tables side by side.
(2) Look at ratios and headcounts together
Even a success rate of 80% means something different if the sample is just 5 people. Be suspicious of charts that hide the denominator (number of attempts or people).
(3) Separate causation from correlation
Just because the combined result flipped does not mean you should immediately pin down a “cause.” First check whether there was an experimental design or random assignment.
(4) State the unit of your conclusion
Make it explicit in the sentence whether it is “based on all patients” or “based on severe patients.” Even with the same data, recommendations can change when the reference group changes.
Simpson’s paradox can show up anywhere ratios appear, such as opinion polls in the news, hospital scorecards, A/B tests in apps, and school admissions statistics. The more convenient the totals, the more you need the attitude of breaking them down once more. The flashier the infographic, the more often the denominators and layers are hidden, so it helps to make a habit of first checking “what is the unit of this number?”
Not stopping in front of a total, but asking “which layers produced this number?”—that is the first step in statistical thinking.