
The normal distribution is a distribution that plays an important role in many areas of statistics and mathematics, and it is also widely used in various areas of everyday life. In data analysis, the normal distribution serves as a fundamental tool, and understanding and applying it is essential for every data analyst and related professional.
In this article, we will start with the basic concepts and characteristics of the normal distribution, take an in-depth look at its mathematical definition and properties, and concretely explore how it can be applied in practice through real-life use cases. Through this, we will take a detailed look at how the normal distribution is used in data analysis and statistical approaches.
Basic Concepts and Characteristics of the Normal Distribution
The Basic Concept of the Normal Distribution
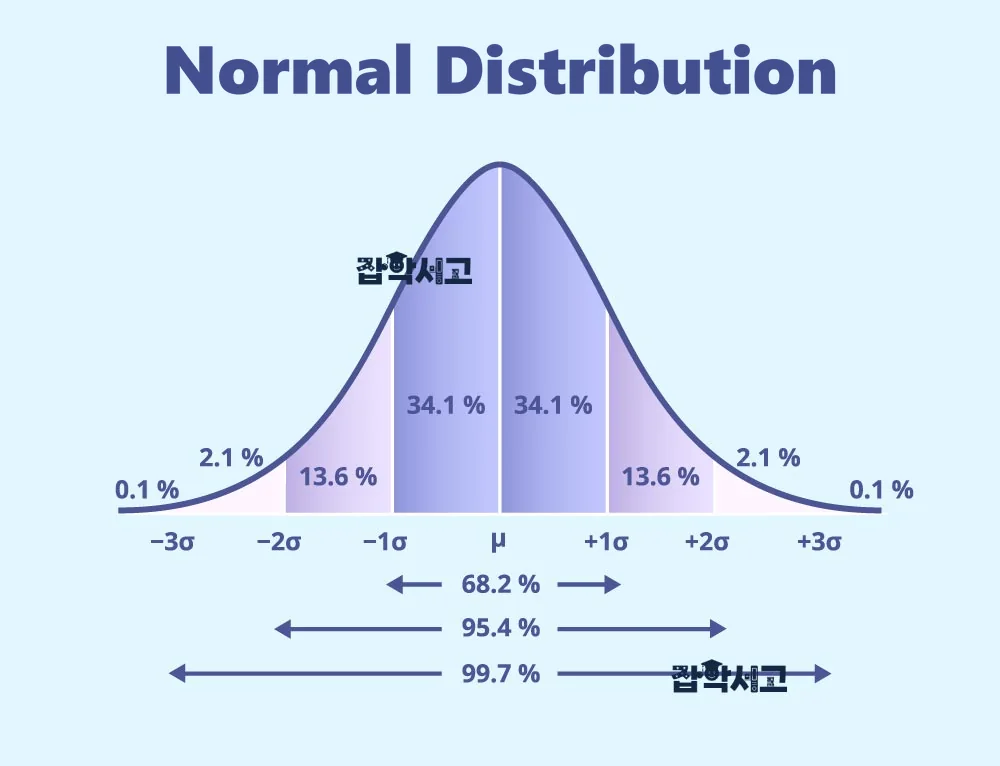
The normal distribution is a distribution in which data spread symmetrically around the mean. It forms a bell-shaped curve and is useful for describing data arising from natural and social phenomena. For example, physical traits such as people's height and weight tend to follow a normal distribution. The normal distribution is also commonly called the 'Gaussian distribution,' and it is used as a tool that effectively explains how values are distributed in a particular phenomenon.
The most important feature of the normal distribution is that it is determined by the mean (μ) and the standard deviation (σ). The mean indicates the center of the distribution, and the standard deviation indicates how widely the values are spread out around the mean. When the standard deviation is small, the data are clustered close to the mean, and when it is large, they are spread more widely. This makes it easy to grasp the shape of the distribution.
Characteristics of the Normal Distribution Graph
The graph of the normal distribution has a very distinctive shape. The symmetrical, bell-shaped curve spreads out equally to the left and right of the mean. In theory, the curve extends infinitely and exists over the entire range of real numbers, but in real data, extremely extreme values rarely appear. In practice, such extreme values are often ignored.
The standard deviation, which shows how values are distributed around the mean in a normal distribution, is an important factor that determines the width of the distribution. The smaller the standard deviation, the narrower and more peaked the curve; the larger the standard deviation, the wider and flatter the curve. These characteristics let us intuitively see how concentrated the data are around the mean.
Relationship with the Central Limit Theorem
One of the important characteristics of the normal distribution is its close relationship with the central limit theorem. The central limit theorem states that, whatever the shape of the population's distribution, when the sample size is large enough, the sample means come to follow a normal distribution. In other words, values obtained through many experiments or repeated observations tend to converge to a normal distribution.
This theorem applies to many fields in real life. For example, when analyzing survey results or experimental data, once a large amount of data accumulates, it eventually takes on a shape similar to a normal distribution. Therefore, the normal distribution plays a key role in complex data analysis and is useful in a wide variety of situations.
The Probability Density Function of the Normal Distribution
The normal distribution takes the form of a probability density function, which allows us to calculate the probability that a value will fall within a specific range. This function makes it possible to express numerically the probability of an event occurring within the distribution. Through it, we can probabilistically predict the likelihood of a particular value appearing or how often values within a range appear.
For example, assuming that the average quality score of a particular product is 85 points, we can calculate the probability of a product scoring 90 points or higher. Using the probability density function of the normal distribution, we can solve a variety of real-life problems like this.
Using the Normal Distribution in Real Life
The normal distribution is not limited to academic theory; it is also used in many areas of real life. In medicine, the normal distribution is often used to analyze physiological data such as patients' blood pressure and blood sugar levels. In finance, the normal distribution is applied to evaluate stock returns and market risk. In this way, the normal distribution is very useful for solving everyday problems, and the ability to understand and use it is essential for a wide range of analytical work.
A proper understanding of the normal distribution can improve the accuracy of data analysis. This distribution is a powerful tool for intuitively describing and predicting data, and it is applied in practice in countless fields.
Exploring the Mathematical Definition and Properties of the Normal Distribution
Mathematical Definition of the Normal Distribution
Mathematically, the normal distribution is defined by its probability density function (PDF), which expresses the distribution of data as a formula. The probability density function of the normal distribution takes the following form.

In this formula, μ represents the mean and σ represents the standard deviation. The function is defined over all real numbers, and the shape of the curve changes depending on the mean and standard deviation. The mean μ indicates the center of the curve, and the standard deviation σ determines the width of the curve. This function concisely describes the essence of the normal distribution and serves as an important foundation for understanding its characteristics.
Properties of the Normal Distribution
The normal distribution has some very distinctive properties. First, the distribution is completely determined by just two factors: the mean and the standard deviation. If two distributions have the same mean and standard deviation, they are regarded as the same normal distribution. This simplicity makes the normal distribution easy to use in a wide range of analyses.
In addition, the normal distribution is symmetric and extends infinitely. This symmetry means that the distribution spreads out equally to the left and right of its mean, with equal probabilities on the left and right sides of the mean. This property is very useful when assessing the central tendency of data or analyzing variability.
Conversion to the Standard Normal Distribution
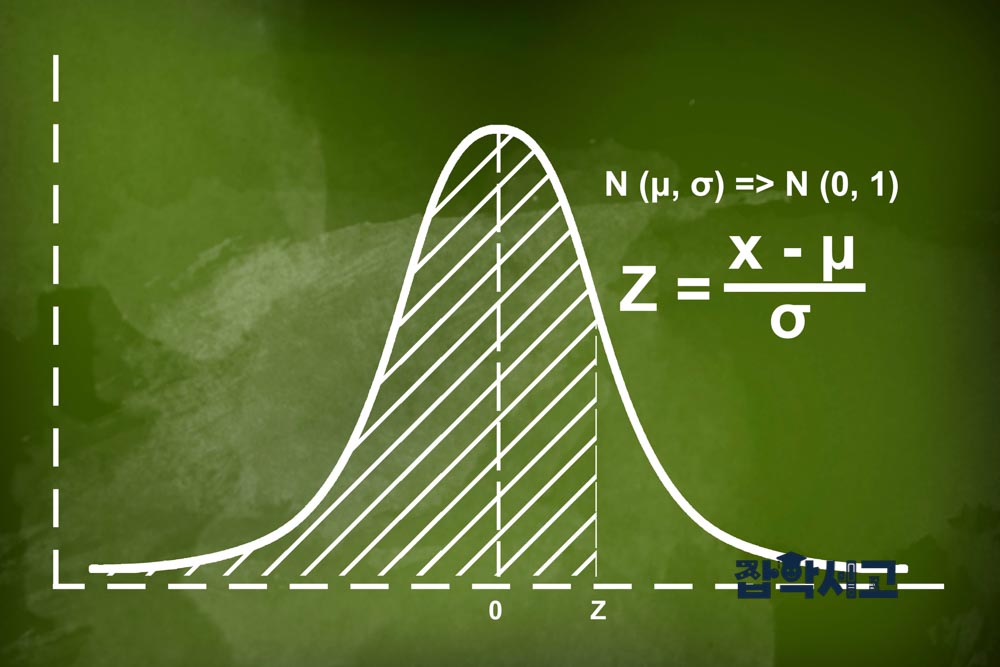
One of the important mathematical properties of the normal distribution is that it can be standardized. Any normal distribution can be converted into the standard normal distribution, which has a mean of 0 and a standard deviation of 1. This makes even complex data easy to compare and applicable to a variety of analyses. Standardization is carried out using the following conversion formula.
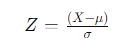
This standardization process is very useful in a variety of data analysis situations. For example, data that follow different normal distributions can be compared on the same basis, and the relative position of data can be identified more clearly.
Using the Cumulative Distribution Function
With the normal distribution, the cumulative distribution function (CDF) can be used to calculate the probability of a value at or below a specific value. This function is very useful for predicting the probability of an event occurring within a specific range. Using the cumulative distribution function, you can obtain important information for a variety of statistical problems, especially hypothesis testing and calculating confidence intervals. This allows for a deeper understanding and analysis of the distribution of data.
Approximating Other Distributions
The normal distribution is used as an important tool for approximating many other distributions. For example, under certain conditions, the Poisson distribution and the binomial distribution can be approximated by the normal distribution. Such approximation methods help analyze complex distributions more simply. For example, as the sample size grows, the binomial distribution approaches the normal distribution, which is useful in many data analysis processes.
Analyzing Real-Life Applications of the Normal Distribution

Test Score Distributions and the Normal Distribution
The normal distribution is one of the most commonly observed distributions in real life, and it often appears in the distribution of test scores. In many tests, students' scores take the form of a normal distribution spread symmetrically around the mean. For example, most students receive middling scores, while relatively few receive extremely high or low scores. In test scores, the mean usually represents an intermediate level of achievement, and the standard deviation represents the differences in performance among students. Based on these characteristics, teachers can analyze the score distribution to evaluate learning outcomes or to classify students according to specific achievement levels.
Using the Normal Distribution in Medicine
The normal distribution also plays an important role in medicine. For example, biometric measurements such as the birth weight of newborns or the blood pressure of adults often follow a normal distribution. Based on such data, doctors can determine whether a particular measurement is within the normal range. Because values outside the standard range around the mean can be signs of disease, the normal distribution helps detect and respond to abnormal conditions early. For example, if a newborn's weight is far below or above the average, it may be a signal that additional medical examination is needed. Through the normal distribution, medical staff can assess patients' conditions more accurately, and it serves as an important reference in diagnosis and treatment.
The Normal Distribution in Economic Data Analysis
The normal distribution is also frequently used in economics. For example, the distribution of returns in the stock market is known to roughly follow a normal distribution. This provides investors with very useful information for assessing the risks of the stock market. The standard deviation represents the volatility of stock returns, and on this basis investors can analyze risk and manage their investment portfolios more carefully. The normal distribution also plays an important role in simplifying complex financial models. By assuming a normal distribution when forecasting stock volatility or returns, investors can make more sophisticated predictions.
Quality Control and the Normal Distribution
In quality control, the normal distribution is used to evaluate the consistency of manufacturing processes. Measurements such as product dimensions and weight generally follow a normal distribution when the manufacturing process is stable. For example, when the parts of a particular product are being produced to a set standard size, their sizes form a normal distribution around the mean. This indicates that the production process is being maintained stably. On the other hand, if the data deviate significantly from a normal distribution, it may suggest a problem with the production process. Through this kind of analysis, quality control managers can improve processes and increase product consistency.
Applications in Psychology
The normal distribution also plays an important role in psychological research that measures things like human cognitive ability and reaction time. Data on people's cognitive ability, learning speed, reaction time, and so on usually follow a normal distribution. This helps researchers identify the average cognitive ability of a particular group and explain individual differences through the standard deviation. For example, when analyzing the cognitive abilities of a particular age group, each individual's ability can be evaluated based on the mean and standard deviation. Such analyses are used to design personalized programs in education and psychotherapy.
The Normal Distribution in Big Data Analysis
The normal distribution also plays an important role in big data analysis. The larger the dataset, the more the averages of individual data tend to approach a normal distribution. This characteristic makes it a very useful tool for data scientists who deal with large-scale data. Using the normal distribution, you can identify patterns in data and design predictive models, which helps increase the reliability of data analysis. For example, when analyzing website visitor numbers or product purchase patterns, the normal distribution can help predict consumer behavior more accurately.
How to Use the Normal Distribution Through a Statistical Approach

The Normal Distribution and Hypothesis Testing
The normal distribution forms an important foundation of statistical inference and is especially widely used in hypothesis testing. Hypothesis testing is an important method for determining whether the results obtained in a study are merely the product of chance or reflect a meaningful difference. When analyzing the difference in means between two groups, for example when testing the effect of a particular drug, it is necessary to determine whether the effect is real or simply due to chance. In this case, a t-test is used to evaluate whether the difference in means between the two groups is statistically significant, and the normal distribution serves as an important criterion in this testing process.
Through the shape of the normal distribution, we can judge how large the difference between two groups is and whether that difference is statistically significant. This allows us to conclude whether research results are reliable and to gain important insights for decision-making.
The Assumption of Normally Distributed Residuals in Regression Analysis
The normal distribution is also essential in regression analysis. A regression model is used as a tool to describe data and their relationships, and it assumes that the residuals (the differences between predicted and actual values) follow a normal distribution. If the residuals follow a normal distribution, it is a sign that the model fits the data well, and it means the predictions are highly reliable.
If the residuals in a regression analysis do not follow a normal distribution, there may be a problem with the model, and it is difficult to trust the prediction results. Therefore, the process of using the normal distribution to verify whether the model fits the data well is essential. If the residuals deviate from a normal distribution, data transformation or model improvement may be necessary. This increases the reliability of the analysis and allows for more accurate predictions.
Sampling and the Normality of the Sample Mean
The normal distribution also plays an important role in sampling theory. When analyzing large-scale data, individual data points may follow a particular distribution, but the distribution of their sample means approaches a normal distribution according to the central limit theorem. This phenomenon becomes clearer as the sample size increases.
Thanks to this property, researchers assume a normal distribution when estimating the population mean from sample data. When working with large-scale data, analyzing samples based on this assumption greatly increases the reliability of the results. In this way, the normal distribution has become a key tool in the sampling process for ensuring accurate parameter estimation.
The Role of the Normal Distribution in Setting Confidence Intervals
A confidence interval is an important indicator for evaluating the uncertainty of analysis results, and the characteristics of the normal distribution are used to set confidence intervals for the mean. For example, setting a 95% confidence interval means that if samples were drawn the same way and an interval were built many times, about 95% of those intervals would contain the true population mean.
The normal distribution plays a very important role in setting such confidence intervals. The interval is calculated using the normal distribution based on the sample mean and standard deviation, and this process increases the reliability of the analysis. Setting confidence intervals accurately makes it possible to present the uncertainty of the analysis results clearly, and they serve as an important reference in decision-making.
The Normal Distribution in Evaluating and Improving Predictive Models
The normal distribution also plays an important role in evaluating the performance of predictive models. To evaluate whether a predictive model explains the data well, it is necessary to analyze whether the errors generated by the model (the differences between predicted and actual values) follow a normal distribution. If the errors follow a normal distribution, it indicates that the model fits and explains the data well and that its predictions are reliable. On the other hand, if the errors deviate significantly from a normal distribution, it is a signal that the model is not a good fit or needs further modification.
Analyzing a model's errors to check for normality is essential for increasing prediction accuracy and improving model performance. This makes it possible to evaluate how well the model fits and, if necessary, to improve the model's structure to make predictions that better match the data.
Outlier Detection and the Normal Distribution
The normal distribution is also used as an important tool for detecting outliers. When data follow a normal distribution, values that deviate significantly from the mean can be considered outliers. Because outliers can distort analysis results, it is very important to detect and handle them properly.
Using the characteristics of the normal distribution, you can effectively detect values that stray from the rest of the data, which helps improve data quality. In particular, removing or handling outliers increases the reliability of the analysis and leads to more accurate results.
The normal distribution forms an important foundation of data analysis and statistics, and its usefulness has been proven in many areas of real life. In this article, we explored how this distribution is used as a key tool in data analysis, based on its basic concepts, its mathematical definition, and its real-life applications.
An accurate understanding and use of the normal distribution is essential for increasing the reliability and accuracy of statistical analysis. I hope you will continue to gain a deep understanding of the characteristics of the normal distribution and, on that basis, carry out more precise and reliable analyses.