
In the 1930s, the south-central United States was battered by fierce dust storms and drought. People in Oklahoma whose crops had failed packed up and left for California in the west, and they were called ‘Okies.’ There is a joke from this period said to have been made by the Oklahoma-born comedian Will Rogers. It goes like this: when the Okies left Oklahoma and moved to California, they raised the average intelligence of both states.
The claim that both averages went up even though not a single person became any smarter sounds at first like a play on words. But if you work through the numbers, the joke actually holds. The phenomenon in which merely moving part of one group into another group raises the averages of both groups is called the ‘Will Rogers Phenomenon.’
In this article, we will look in turn at where the name Will Rogers phenomenon came from and its basic principle, an example traced through numbers, the case of cancer stage migration in medical statistics, and how to avoid being fooled by this kind of illusion.
An Average That Rises Just by Moving: The Will Rogers Phenomenon
The Origin of the Name and the Basic Principle

The logic of the joke is this. The people who left were somewhat below average in Oklahoma, but above the local average once they reached California. So Oklahoma’s average rises because the people dragging it down have left, and California’s average rises because people who pull it up have arrived.
However, it is not clear whether these words really came from Will Rogers. They became known as his only decades after his death, and similar jokes with just the places and people swapped were already circulating before that.
For this phenomenon to occur, one condition is needed. The value of the person who moves must be lower than the average of the group they leave and higher than the average of the group they join. As long as this condition is met, that person does not need to be the lowest or the highest in the group.
Following Along with Numbers

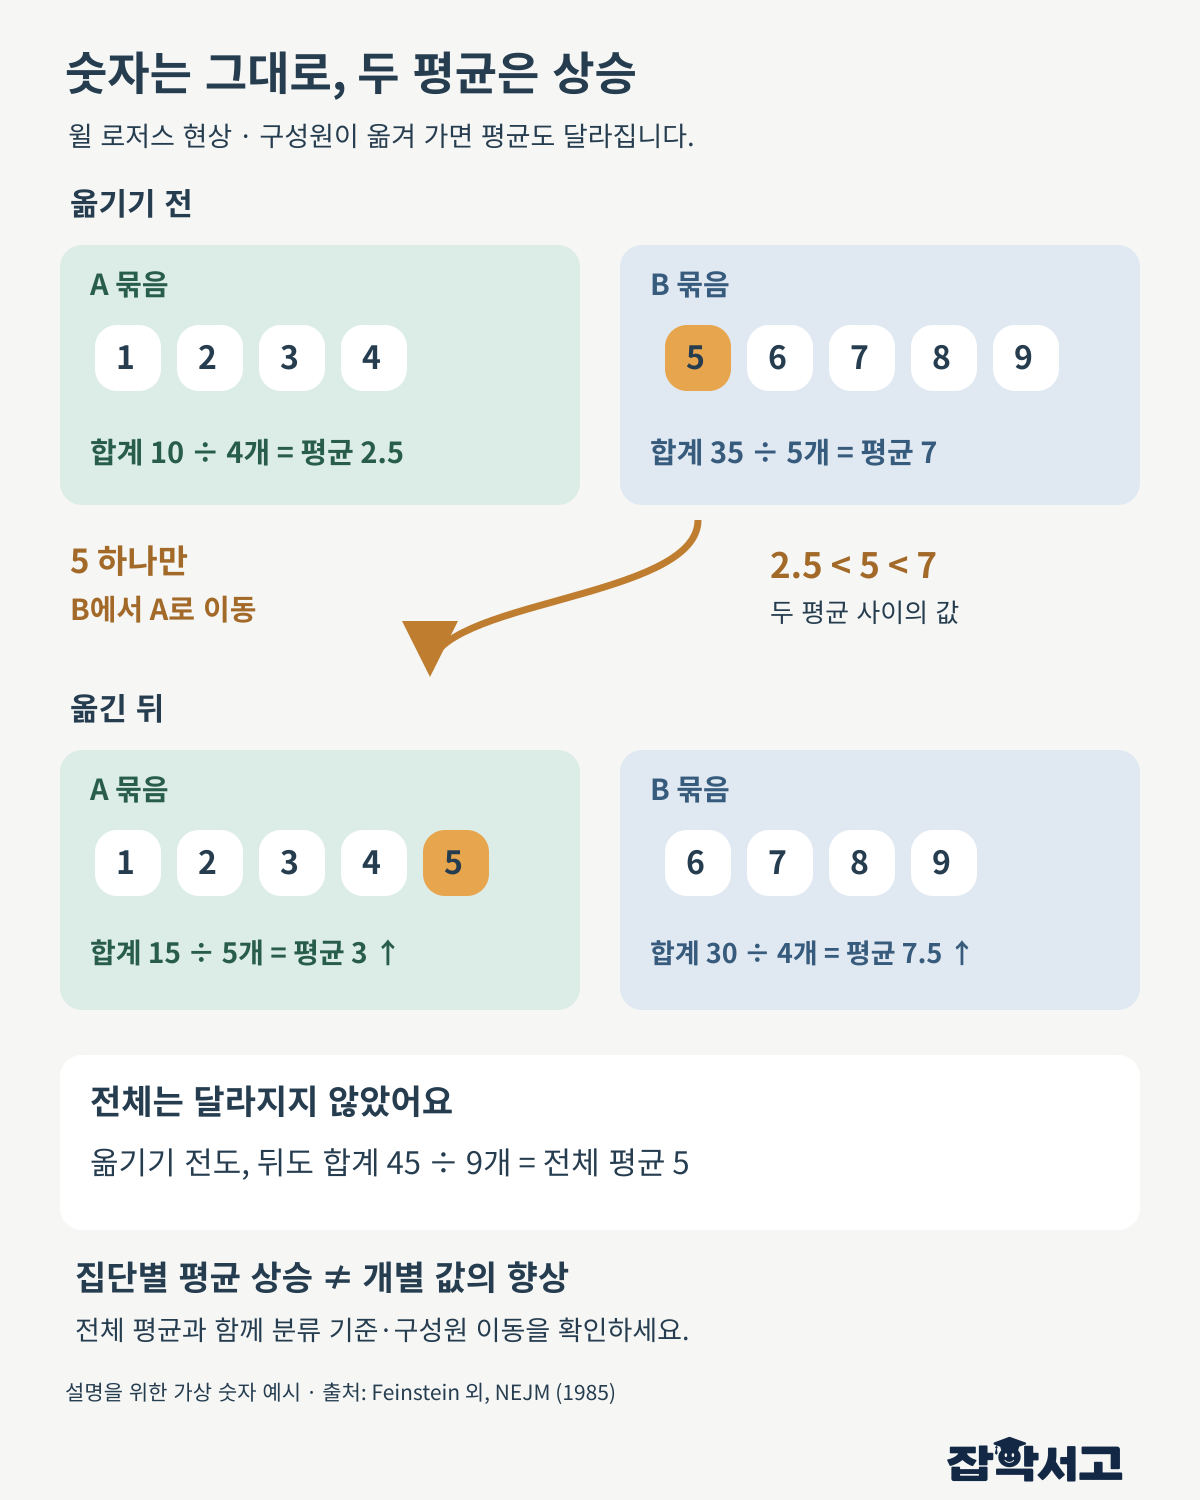
Let’s check this with two simple sets of numbers. Set A is 1, 2, 3, 4, and Set B is 5, 6, 7, 8, 9.
(1) Before Moving
The average of Set A is 2.5, and the average of Set B is 7. The average of all nine numbers is 5.
(2) Move One Number
Move 5, the smallest number in Set B, to Set A. 5 is smaller than Set B’s average of 7 and larger than Set A’s average of 2.5.
(3) After Moving
Set A becomes 1, 2, 3, 4, 5, and its average rises to 3; Set B becomes 6, 7, 8, 9, and its average rises to 7.5. Yet the overall average is still 5.
There are even more extreme cases. If you have one set made up of 1 and 2 and another made up of 99, 10,000, and 20,000, and you move 99 to the first set, the first set’s average jumps from 1.5 to 34 and the second set’s average jumps from about 10,033 to 15,000 at the same time.
It looks as though both sets have improved, but not a single number has changed. The overall average is the combination of each set’s average weighted by the number of members, so it stays the same; only the boundary line has moved.
Cancer Stage Migration: Survival Rates Created by Statistics

This joke reappeared as a serious problem in medical statistics. In 1985, a research team led by Alvan Feinstein at Yale University in the United States gave this phenomenon Will Rogers’s name in a paper comparing the survival rates of lung cancer patients. It is said that the name came about because a friend had told him the joke as something Will Rogers said.
When the researchers compared patients treated at the same hospitals in 1953–1964 with patients first treated in 1977, the later patients had higher six-month survival rates in all three main stages. It was a result that made treatment look as if it had advanced greatly. However, the later patients had undergone several imaging tests newly introduced in the meantime, and many of them had small metastases detected that would not have been visible before, so they were reclassified into more advanced stages.
The patients who moved had been in relatively poor condition within their original stage, but in relatively good condition within their new stage. As a result, survival rates appeared to rise in both stages. This is called Stage Migration, and it shows that results can look better simply because diagnostic methods change, even if treatment does not improve. In fact, when the researchers regrouped the patients using symptom-based criteria unrelated to testing technology, the survival rates of patients from the two periods were similar.
Similar cases have been reported for other diseases as well. In 2008, a study was published showing that the same phenomenon could occur in multiple sclerosis as new diagnostic criteria using magnetic resonance imaging (MRI) came into use. The more sensitive tests become, the more people with mild symptoms are also classified as patients, so the course of the patient group can look better than it really is.
How Not to Be Fooled by the Illusion

The Will Rogers phenomenon can occur not only in hospitals but anywhere people are divided into grades or groups, such as school, company, and regional statistics. Simply changing class assignments or adjusting grading criteria can make the averages of every class and every grade appear to rise. To avoid this kind of illusion, it helps to get into the habit of checking the following.
- Overall Average: Don’t look only at the averages of each group; also check whether the combined average of everyone has actually changed.
- Classification Criteria: Check whether the two periods or two institutions being compared divided their groups using the same criteria.
- Migrated Members: Separate out who moved from which group to which, and weigh their impact.
An average is a convenient number that shows a group at a glance, but depending on where you draw the boundary line, it can show a completely different face. When faced with numbers saying everyone has improved, first asking who moved where is the first step of statistical thinking that strips away numerical illusions.