
When starting a business or launching a new business project, the metric many people fixate on first is revenue. Yet it is common to see companies and self-employed business owners suffer losses and close down despite generating tens of millions of won in monthly revenue. Why does the bank balance shrink even as revenue grows?
The reason is that they lacked an accurate understanding and calculation of the break-even point (Break-Even Point, BEP). The break-even point is the point at which total revenue (Revenue) and total costs (Total Cost) incurred over a given period match exactly, resulting in neither a profit nor a loss.
In business administration, the break-even point goes beyond a simple accounting formula: it is the minimum threshold a company must cross to survive and a key indicator for assessing a business's profitability. This article systematically covers the key components of the break-even point, calculation methods, practical examples, and management strategies for maximizing profits by lowering the break-even point.
The Structure of the Break-Even Point and Its Use in Management
The Two Faces of Costs: Fixed Costs vs. Variable Costs
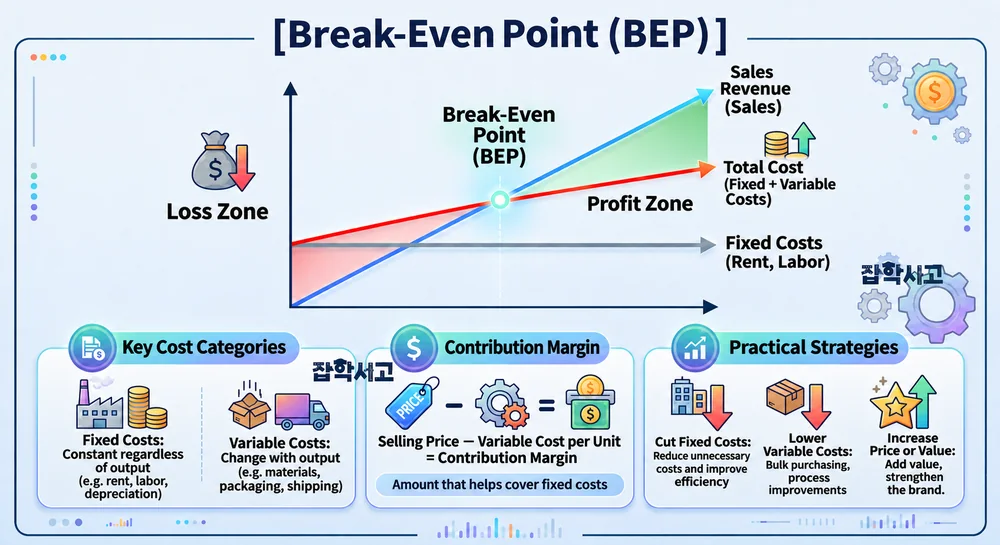
The first step in understanding the break-even point is to clearly classify all of a company's costs as either fixed costs or variable costs.
Fixed Costs (Fixed Cost, FC)
Concept: These are costs that remain constant each month or year, regardless of the quantity of products produced or services sold.
Main items: Office and store rent, permanent employees' wages, equipment depreciation, insurance premiums, telecommunications expenses, and so on.
Characteristics: Even when sales volume is 0 units, fixed costs continue to drain funds by the same amount.
Variable Costs (Variable Cost, VC)
Concept: These are costs that change in direct proportion to increases and decreases in the quantity of products produced or services sold.
Main items: Raw material costs, packaging costs, hourly wages for part-time workers, sales commissions, shipping costs, and so on.
Characteristics: Total variable costs increase as sales volume grows, but the variable cost per 1 unit of product often remains constant.
Understanding the Structure of the Break-Even Point

The break-even point (BEP) is where the revenue line intersects the total cost line (fixed costs + variable costs). If sales volume is below this point, the business remains in the loss zone (a deficit), and revenue generated from the moment this point is exceeded shifts into the pure profit zone (a surplus).
Break-Even Formulas and Contribution Margin

The key concept in determining the break-even point is the contribution margin (Contribution Margin).
Contribution margin = Selling price - Variable cost per unit
The contribution margin is the amount remaining after variable costs are deducted from the sale of 1 unit of a product—the amount that contributes toward covering fixed costs. Once all fixed costs have been covered by the contribution margin, any contribution margin generated thereafter becomes the company's operating profit.
Based on this concept, the formulas for calculating break-even sales volume and revenue are as follows.
Break-even sales volume = Fixed costs / (Selling price per unit - Variable cost per unit)
(In other words, fixed costs / Contribution margin per unit)
Break-even revenue = Fixed costs / Contribution margin ratio
(Where contribution margin ratio = Contribution margin / Selling price)
A Practical Example to Aid Understanding: Calculating the Break-Even Point for Cafe Mocha
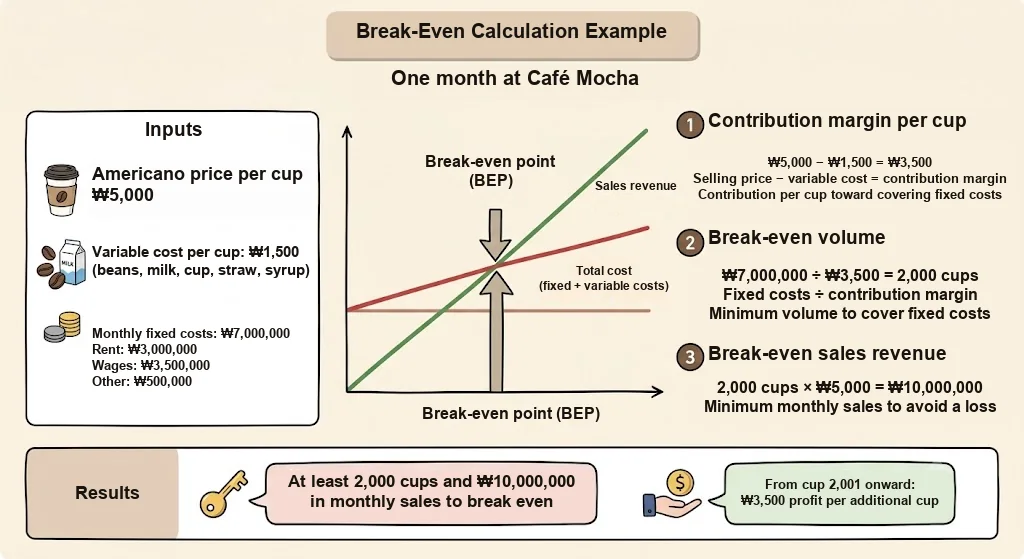
To help explain the concept, let us use a month's operating data from Cafe Mocha, a specialty shop serving handcrafted coffee, as an example.
- Assumptions
- Selling price for 1 cup of Americano: 5,000 won
- Variable cost per 1 cup: 1,500 won (costs of coffee beans, milk, cups, straws, and syrup)
- Monthly fixed costs: 7,000,000 won (rent: 300 × ten thousand won + monthly staff salaries: 350 × ten thousand won + other miscellaneous expenses: 50 × ten thousand won)
Step 1: Calculate the Contribution Margin per 1 Cup
5,000 won (selling price) - 1,500 won (variable cost) = 3,500 won (contribution margin)
(In other words, the fixed costs of 700 × ten thousand won are covered in increments of 3,500 won each time a cup of coffee is sold.)
Step 2: Calculate the Break-Even Sales Volume
7,000,000 won (fixed costs) / 3,500 won (contribution margin) = 2,000 cups
Step 3: Calculate the Break-Even Revenue
2,000 cups x 5,000 won = 10,000,000 won
Analysis Results
Cafe Mocha must sell at least 2,000 cups of coffee per month (an average of about 67 cups per day), achieving monthly revenue of 1,000 × ten thousand won, to avoid a loss. Starting with cup number 2,001, every 1 cup of coffee sold yields a net profit of 3,500 won.
3 Management Strategies for Lowering the Break-Even Point

A manager's goal is to lower the break-even point as much as possible and quickly move the business into a profitable structure. Practical strategies for lowering the break-even point fall into three broad categories.
Reducing Fixed Costs
This strategy involves moving to an area with lower rent, or reducing on-site staff and introducing automation and outsourcing. Lower fixed costs directly reduce the sales volume required to break even.
Reducing Variable Costs per Unit
Examples include lowering unit costs through bulk purchases of raw materials and reducing part-time workers' working hours by making processes more efficient. Lower variable costs increase the contribution margin per cup, allowing the break-even point to be reached sooner.
Lowering/Raising Selling Prices and Increasing Added Value
Simply raising prices may lead to a decline in sales volume, so businesses should adopt strategies that increase the contribution margin per unit, such as enhancing brand value or offering set menus.
The Final Step in Decision-Making: Break-Even Analysis
The break-even point (BEP) is not a lagging indicator that aggregates past financial results, but a forward-looking decision-making tool that determines the future direction of management.
Break-even analysis is essential when checking whether a new business has realistic targets before its launch, setting an appropriate selling price for a new product, or running a discount promotion. Managers who understand their break-even point accurately can dramatically reduce risk by setting target sales volumes based on data rather than relying on hunches or intuition.
The success or failure of a business depends not on how much it earns, but on when it can exceed its break-even point. To allocate management resources efficiently and build a company with a healthy underlying structure, it is especially important to develop the habit of regularly updating and managing break-even analysis.