
Every year we see news reports saying that tourism accounts for a certain percentage of a country’s economy, yet did you know that national economic statistics have no separate “tourism industry” in their industrial classification? Hotels are counted under accommodation, airlines under transport, and restaurants under food service. The statistical framework that picks out only the share spent by travelers from these scattered figures and measures the economic size of tourism is called the Tourism Satellite Account.
Put simply, a Tourism Satellite Account means “an auxiliary ledger attached like a satellite to the large ledger of the national accounts, which separately records only visitors’ consumption and the production that meets it.” After early trials in Canada and other countries in the 1990s, it was approved as an international standard by the United Nations (UN) Statistical Commission in 2000, and a revised edition was published in 2008.
In this article, we will look in turn at why tourism is not recorded as a single industry, how the Tourism Satellite Account is structured, how the international standard was developed, and what this ledger can and cannot tell us.
Finding the travel share among scattered figures: the world of the Tourism Satellite Account
1. Why isn’t tourism recorded as a single industry?

National accounts usually divide industries by what they produce. Tourism, however, is an activity defined not by what is made but by who buys it. The same bibimbap at the same restaurant is everyday consumption when a local resident eats it, but tourism consumption when a traveler from another region eats it.
(1) Tourism defined from the demand side
The international standard defines tourism as the activity of visitors. A visitor is a person who travels outside their usual environment for less than a year and whose main purpose is not to be employed and paid there. Tourism is therefore defined starting from demand rather than supply.
(2) Spending scattered across many industries
A single traveler’s spending is divided among many industries, such as airfare, lodging, meals, admission tickets and souvenirs. Looking only at the industrial classification, this money is mixed into each industry’s sales, so the total for tourism does not show up directly.
(3) The name “satellite”
A satellite account is an auxiliary account attached alongside the national accounts to examine a particular field in detail without changing their basic framework. Because it uses the same concepts and classifications as the national accounts, tourism figures can be compared side by side with those of other industries.
2. How is a Tourism Satellite Account structured?

The core of the Tourism Satellite Account is to place the goods and services bought by visitors on one side and the production of the industries that made them on the other, and then match the two. The 2008 international standard organizes this process into 10 tables.
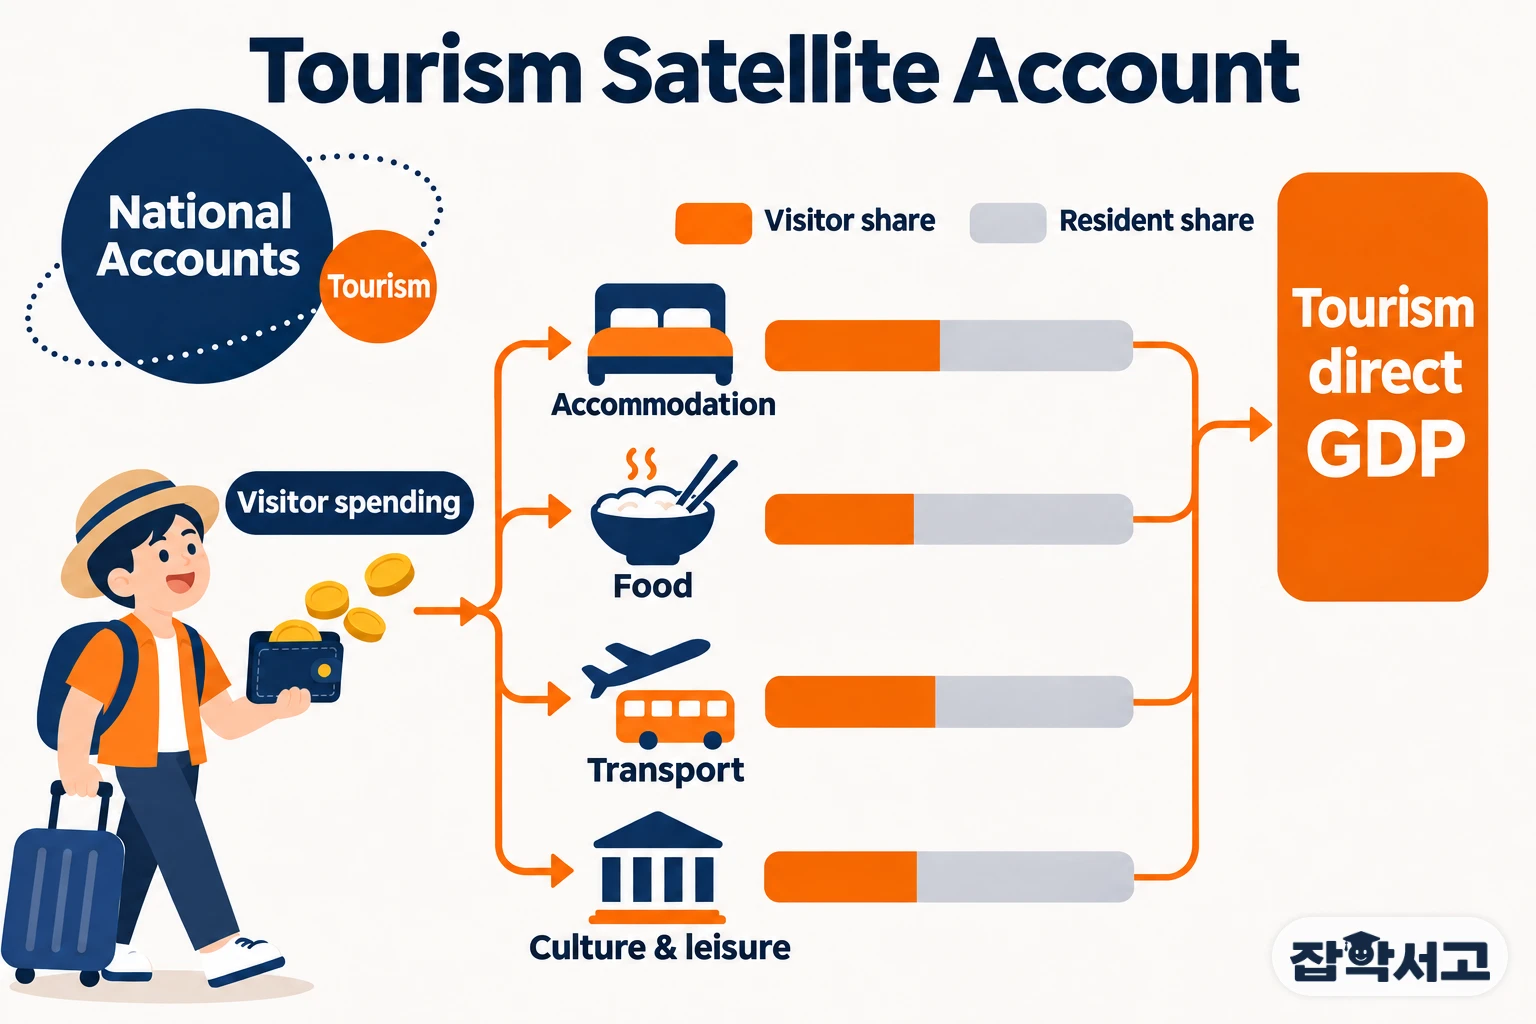
- Tourism consumption (Tourism Consumption): The value of goods and services acquired by visitors for or during their trips.
- Tourism characteristic industries (Tourism Characteristic Industries): Industries that mainly serve visitors, such as accommodation, food and beverage, rail, road, water and air passenger transport, transport equipment rental, travel agencies, culture, and sports and recreation.
- Tourism ratio (Tourism Ratio): The proportion of an industry’s total output that is accounted for by visitor consumption.
- Tourism direct GDP (Tourism Direct GDP): The value added generated in response to visitor consumption, plus taxes less subsidies on the related products and imports.
(1) Tables on the spending side
Tables 1–3 organize, by product, the spending of foreign visitors traveling in the country, residents traveling within the country, and residents traveling abroad. Table 4 gathers the consumption that took place within the domestic economy to calculate internal tourism consumption.
(2) Tables on the production side
Table 5 shows the production accounts of tourism characteristic industries and other industries, and Table 6 matches domestic supply with tourism consumption to find the tourism share of each product. Tourism direct gross value added and tourism direct GDP come from here.
(3) Employment, investment and non-monetary indicators
Tables 7–10 cover employment in the tourism industries, tourism-related gross fixed capital formation, government collective consumption related to tourism, and non-monetary indicators such as the number of trips and nights spent.
3. How was the international standard developed?

Attempts to measure the economic size of tourism within the national accounts have continued since the 1980s. After various countries and international organizations tested their own approaches, they converged on a single common standard.
(1) The discussions that started it
At its 1983 General Assembly in New Delhi, India, the World Tourism Organization (UNWTO) presented a report on how to treat tourism within the national accounts. The recommendations of the international conference on travel and tourism statistics held in Ottawa, Canada, in 1991 were adopted by the UN Statistical Commission in 1993.
(2) Canada’s first results
Canada published its first Tourism Satellite Account results in July 1994. The Organisation for Economic Co-operation and Development (OECD) then put forward a proposal for its member countries in 1997, and the World Tourism Organization presented its own framework at a conference in Nice, France, in 1999.
(3) Approval in 2000 and revision in 2008
The Recommended Methodological Framework (TSA: RMF), refined jointly by the World Tourism Organization, the OECD and the Statistical Office of the European Union (Eurostat), was approved at the 31st session of the UN Statistical Commission in 2000. In 2008, the four agencies, now including the UN Statistics Division, issued a revised edition, and the number of countries involved in Tourism Satellite Account work grew from 44 in 2001 to more than 70 in 2007.
4. What the Tourism Satellite Account shows and its limits

With the Tourism Satellite Account, the economic size of tourism can be compared using the same yardstick as other industries such as manufacturing or agriculture. However, this ledger does not capture every effect tourism has on the economy.
(1) Tourism compared on the same yardstick
Tourism direct gross value added, tourism direct GDP and employment in the tourism industries are calculated with the same concepts as the national accounts, so the weight of tourism can be compared from year to year and between countries. Many national statistical agencies, such as the Australian Bureau of Statistics, compile their own Tourism Satellite Accounts according to this international standard.
(2) A ledger of direct effects only
The Tourism Satellite Account counts only what visitors buy directly. Indirect and induced effects, such as hotels buying ingredients or tourism workers spending their wages, are not included; seeing them requires other tools such as input-output models or computable general equilibrium models.
(3) The difficulty of separating the visitor share
In industries used by both residents and visitors, such as restaurants and public transport, the visitor share must be separated out. This makes separate data such as visitor expenditure surveys essential, and when data are lacking, more of the figures rely on estimates.
Whether it is hotel revenue or a bus fare, every calculation begins by asking once more who paid that money. The simple idea that gathering only what travelers spend reveals the size of tourism is the first step toward understanding the Tourism Satellite Account.