
How can you tell how much attention a newly published research paper is getting? The usual method is to count how many times other papers have cited it. But citations can take years to build up, and in the meantime the paper is covered in the news, debated on blogs and shared on social media. The idea of counting these traces left outside citations as well is called altmetrics.
Altmetrics, simply put, means ‘a new way of measuring research by counting the attention and reactions that papers and other research outputs receive online and on the social web, as a complement to citation metrics.’ The word is a shortened form of the English phrase alternative metrics.
This article looks in turn at how the word altmetrics came about, the five kinds of traces altmetrics count, the main tools that turn attention into scores and pictures, and the points to keep in mind when reading these numbers.
Counting reactions beyond citations: everything about altmetrics
1. An idea to complement slow citation metrics

Measuring the impact of scholarly research in numbers has long been the work of bibliometrics. Citation-based indicators such as the Journal Impact Factor, first proposed in 1955, have been at its center.
(1) The time it takes for citations to build up
Citations are a reliable signal, but they are slow. A citation is added only after another researcher reads the paper, does new research and publishes a new paper, so the echo of a freshly published study is hard to see from citation counts alone. Citation metrics also miss the fact that researchers are not the only people who read and use research.
(2) A name born in a single tweet
The word altmetrics was first used on Twitter in September 2010 by Jason Priem, then a doctoral student at the School of Information and Library Science at the University of North Carolina at Chapel Hill in the United States. The term then spread quickly as researchers shared ideas around the #altmetrics hashtag.
(3) The 2010 altmetrics manifesto
In October of the same year, Priem, together with Dario Taraborelli, Paul Groth and Cameron Neylon, launched Altmetrics.org and published “Altmetrics: A Manifesto.” They defined altmetrics as ‘the creation and study of new metrics based on the Social Web for analyzing and informing scholarship.’
2. The five kinds of traces altmetrics count

Altmetrics are not a single number but a bundle of many kinds of online traces. A classification proposed by ImpactStory in September 2012 divides the reactions a research output receives into five types, and the academic publisher PLOS uses a very similar scheme.
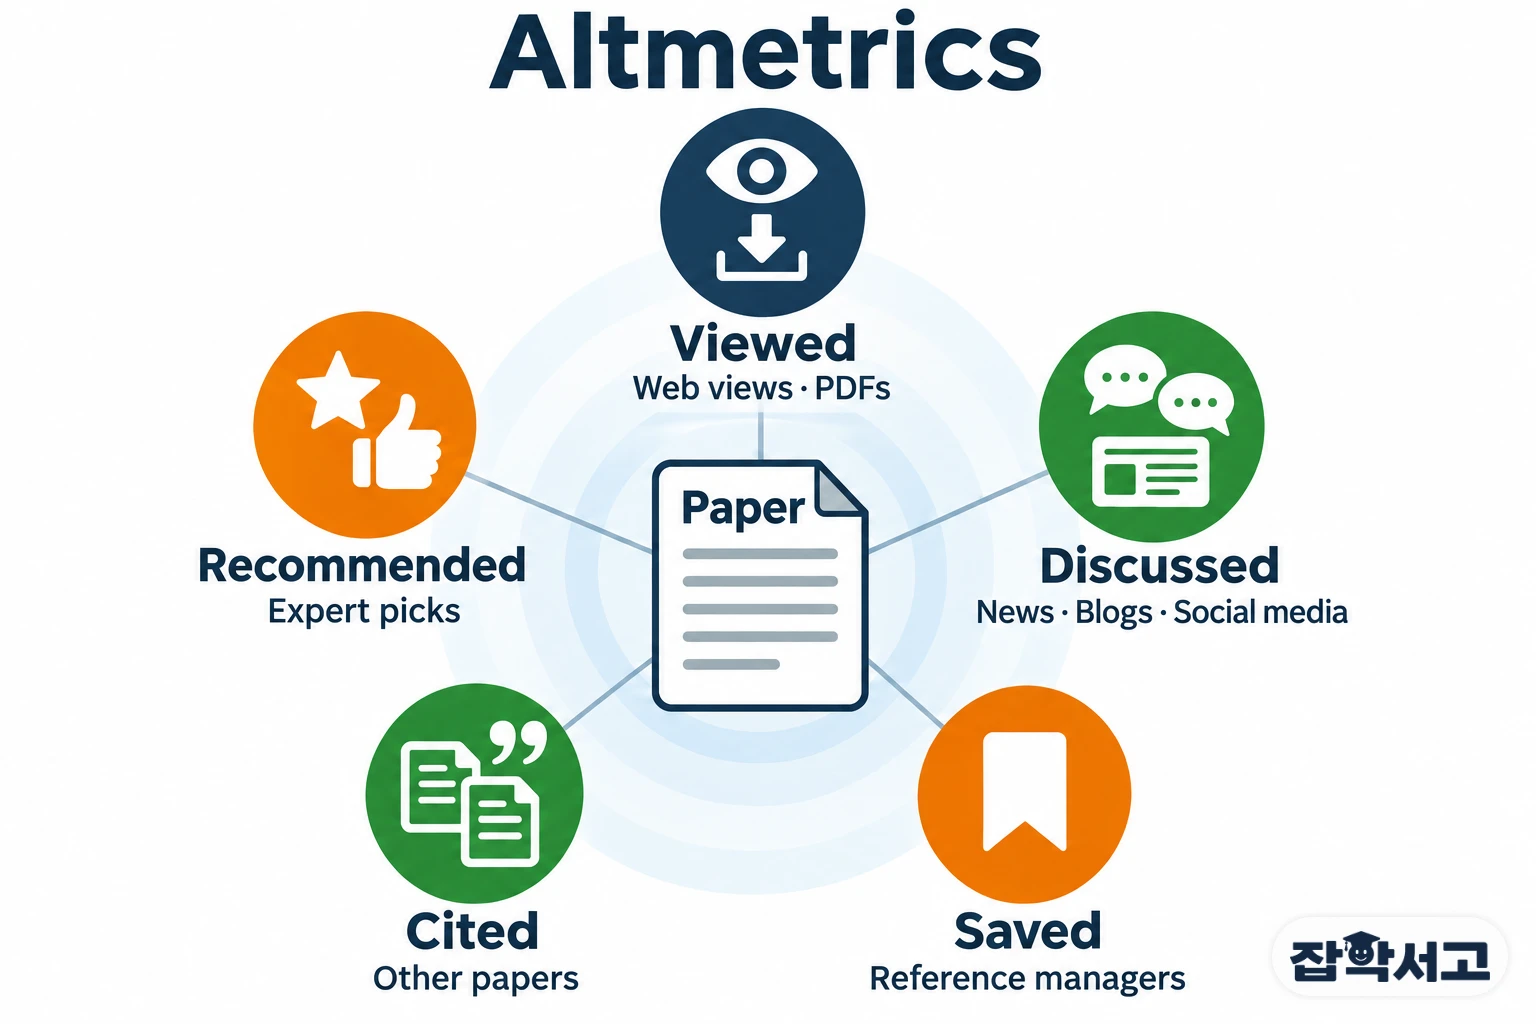
- Viewed: the number of times the paper’s web page was viewed and its PDF was downloaded.
- Discussed: mentions in journal comments, science blogs, Wikipedia and social media such as Twitter and Facebook.
- Saved: the number of times the paper was saved in reference managers and social bookmarking services such as Mendeley and CiteULike.
- Cited: citations counted by services such as Web of Science, Scopus and Crossref.
- Recommended: records of experts picking and recommending good papers, as on F1000Prime.
(1) A basket that holds citations too
As this classification shows, altmetrics are not about throwing citations away. Existing citation metrics become one basket, and views, discussions, saves and recommendations are placed alongside it to take a wider look at the reactions research receives.
(2) Metrics at the level of a single paper
Altmetrics count reactions for each individual paper rather than for a whole journal. This idea grew out of article-level metrics, and PLOS began attaching such metrics to all of its papers in March 2009.
(3) Research outputs beyond papers
What is counted is not limited to papers, either. Research outputs that citation indexes rarely capture, such as datasets and software code, can also have their reactions examined once they are shared and mentioned online.
3. Tools that show attention as scores and donuts

As altmetrics became known, services appeared that gather scattered online reactions in one place. The small colored donuts and scores now seen next to papers on many journal websites are the result.
(1) Altmetric and the colored donut
Altmetric, founded by Euan Adie in 2011, was acquired by Digital Science in 2016. It shows the attention a paper has received as a donut divided into colors by source; for example, news is red and Twitter is light blue.
(2) A weighted attention score
The Altmetric Attention Score in the middle of the donut is not a simple sum of mentions. Each person is counted only once per source, a news article counts for more than a blog post and a blog post more than a tweet, and who wrote the mention is also taken into account.
(3) PlumX and ImpactStory
PlumX from Plum Analytics shows reactions divided into five categories—usage, captures, mentions, social media and citations—and in August 2023 it removed its Twitter metrics. ImpactStory started out as a service that helps researchers see the online reactions to their own work in one place.
4. Fast numbers that must be read with care

Altmetrics show reactions much faster than citations and also reveal how research is received outside academia. But there are a few things to keep in mind when reading these numbers.
(1) Attention is not quality
A high score means that many people paid attention to the research, not that the research is excellent. Eye-catching titles, controversial results and even flawed studies can attract a great deal of attention.
(2) A weak link with citations
In many studies, the correlation between altmetrics and citation counts has generally been weak. One review summarized the correlation coefficient as below 0.30, and a meta-analysis in the health sciences reported a value of 0.19. The two can be seen as measuring different things.
(3) The traps of inflation and comparison
Likes and mentions can even be bought, which makes them vulnerable to manipulation, and the numbers for the same paper change when collection methods or a service’s calculation change. Newer papers have an advantage, so comparisons are best made between papers published around the same time.
In the end, altmetrics are not an answer that replaces citations but another window that lights up the many paths through which research meets the world. The simple idea that not only citations but every hand that reads, discusses and saves a paper leaves a trace of research—that is the first step to understanding altmetrics.