When you travel abroad, you soon notice that the same hamburger costs different amounts in different countries. In some countries it feels quite expensive in your own money, and in others it feels surprisingly cheap. If the price gap is this wide for a product that is almost identical in taste and size, the difference may hide a story about the value of the two countries’ money. The clever way of turning this idea into a number is the ‘Big Mac Index.’
Put simply, the Big Mac Index is ‘an indicator that compares the price of a Big Mac hamburger in countries around the world to gauge whether each country’s currency is priced above or below a fair exchange rate.’ The British weekly business magazine The Economist has published it every year since 1986.
In this article, we will look in turn at how the Big Mac Index came about, the purchasing power parity theory it is based on, how it is actually calculated, and the limits and many variations of the index.
Reading Exchange Rates with a Single Hamburger: How the Big Mac Index Works and How It Is Used
How Did the Big Mac Index Begin?
The Big Mac Index was not created as a serious analytical tool from the start.
(1) It started half as a joke
It began in September 1986, when Pam Woodall, a journalist at The Economist, came up with it half in jest to make difficult exchange-rate theory easy to grasp. The magazine itself describes the index as ‘a tool to make exchange-rate theory a bit more digestible.’
(2) Why the Big Mac?
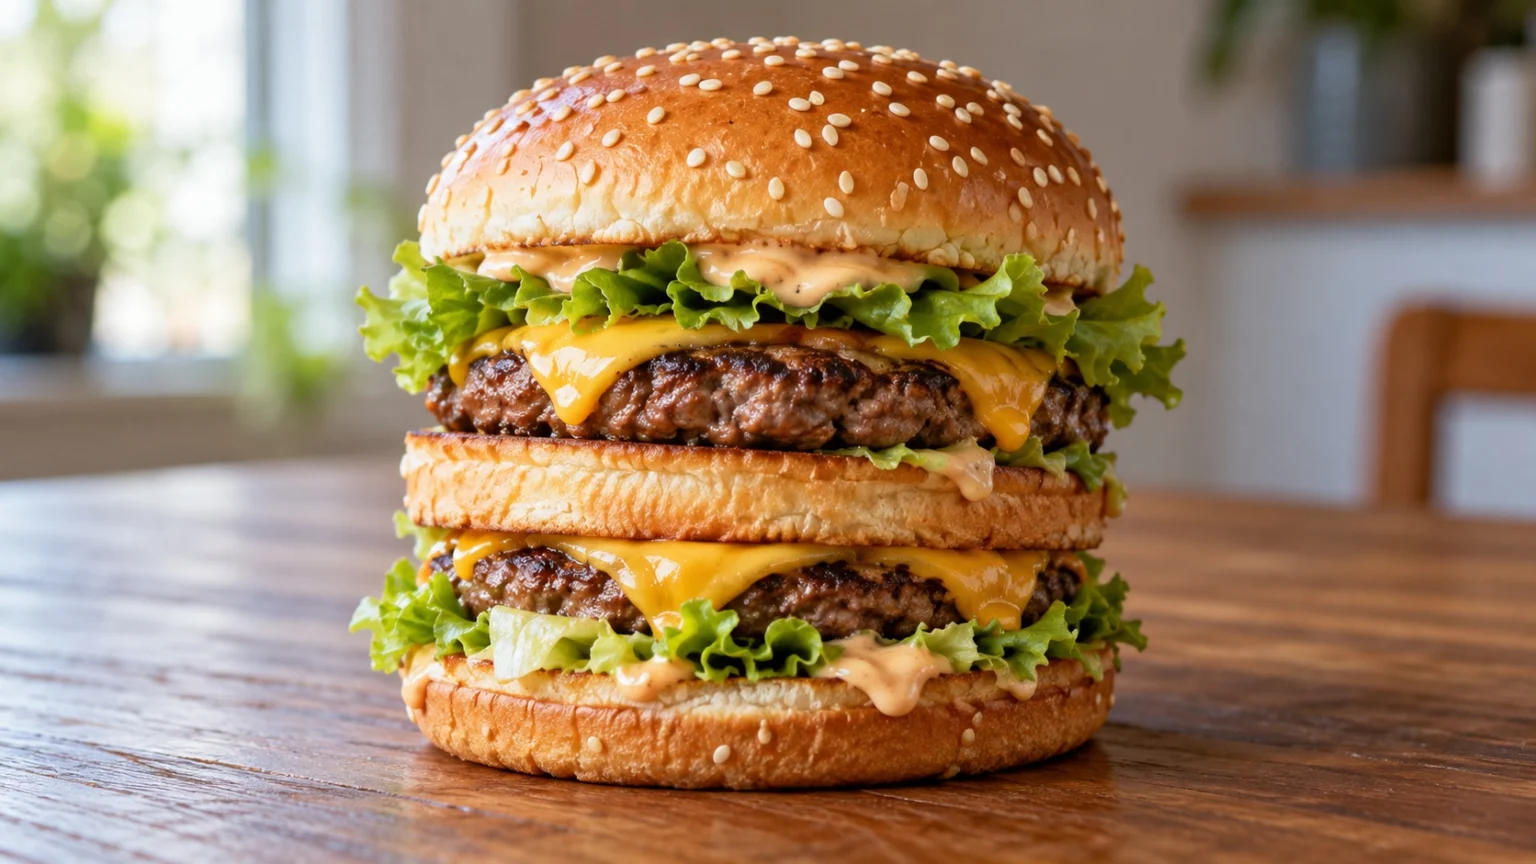
McDonald’s has restaurants all over the world, and its signature Big Mac is made with nearly the same ingredients and methods in every country. On top of that, the price of a single Big Mac reflects not only the cost of ingredients but also many local factors such as wages, rent, and advertising costs.
(3) A joke that made it into textbooks
Although it was never meant to be a formal tool for valuing exchange rates, it is now widely known around the world and appears in many economics textbooks and reports. It even gave rise to the word ‘Burgernomics,’ a blend of burger and economics.
The Theory Behind It: Purchasing Power Parity

The Big Mac Index takes an old idea from economics and puts it into a hamburger.
- Law of One Price: The idea that the same product should cost the same wherever you buy it. If prices differ, people will buy where it is cheap and sell where it is expensive, and prices will eventually even out.
- Purchasing Power Parity: A theory that extends this idea across countries, holding that the exchange rate between two currencies should move to the level at which the same basket of goods can be bought for the same price.
The problem is that it is very hard to match ‘the same basket of goods’ across countries. The purchasing power parity calculations of the Organisation for Economic Co-operation and Development (OECD) include more than 3,000 consumer goods and services alone. The Economist chose the bold simplification of replacing this huge basket with a single Big Mac.
How to Calculate the Big Mac Index

The calculation takes two steps, and the United States is usually used as the base country.
(1) Find the exchange rate the hamburger implies
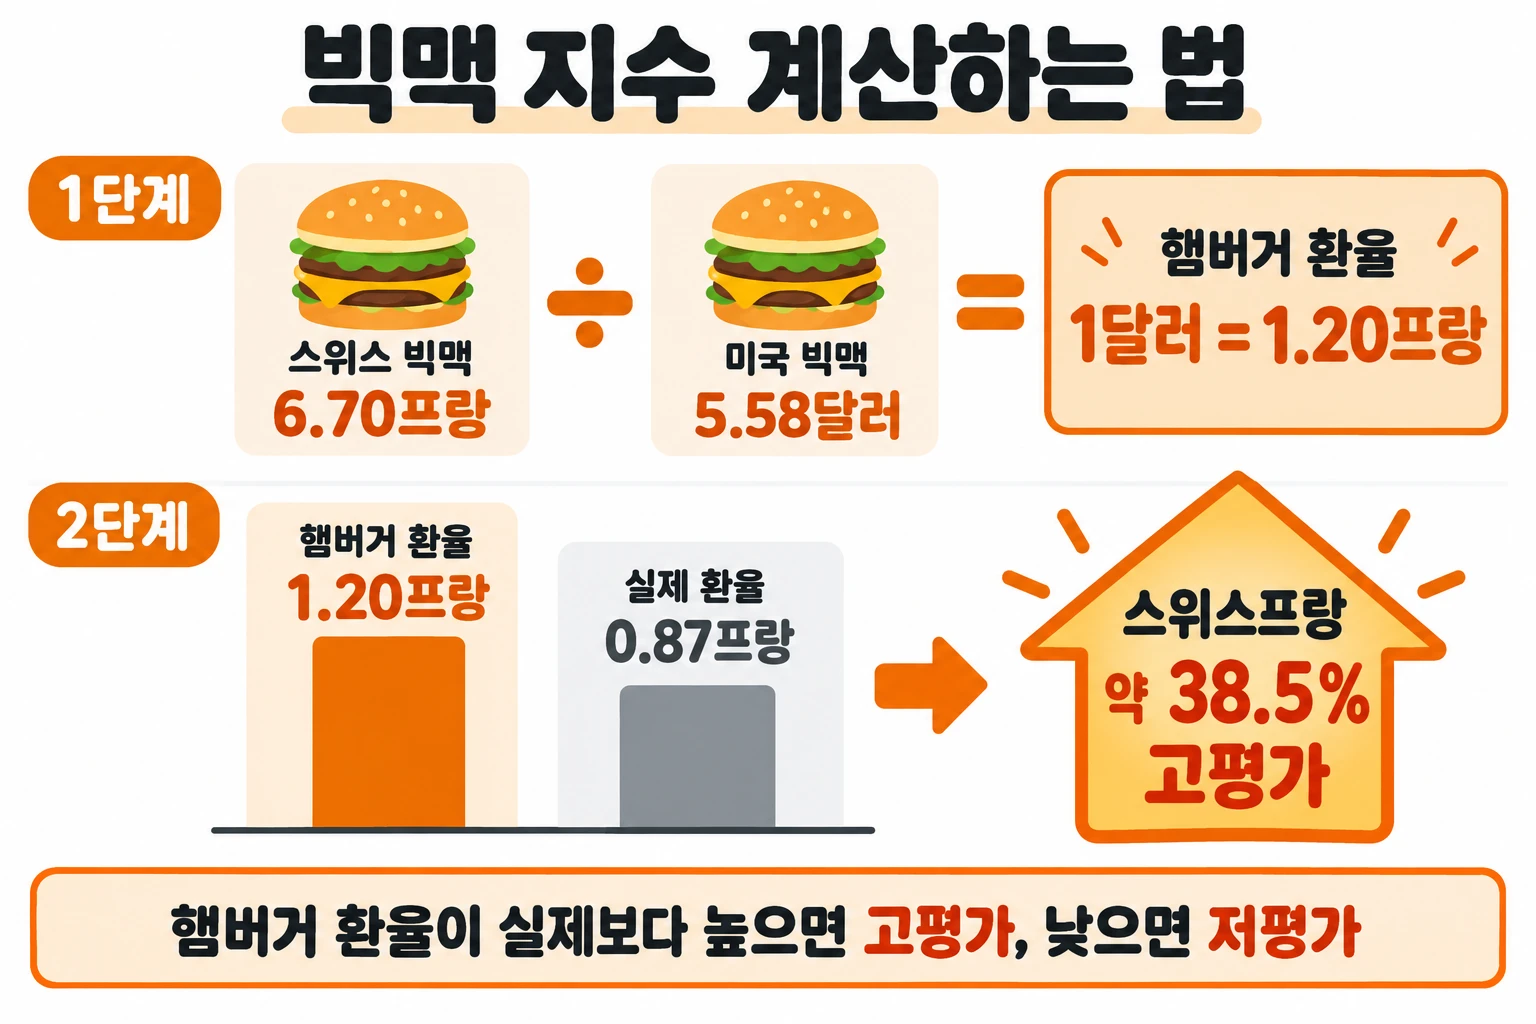
Divide the price of a Big Mac in one country (in its own currency) by the price of a Big Mac in the United States (in dollars). In July 2023, a Big Mac cost 6.70 Swiss francs in Switzerland and 5.58 dollars in the United States, so the hamburger exchange rate comes to about 1.20 francs per dollar.
(2) Compare it with the actual exchange rate
At the time, the actual exchange rate was about 0.87 francs per dollar. Because the rate implied by the hamburger is higher than the actual rate, by this calculation the Swiss franc was about 38.5% overvalued against the dollar. Conversely, if the hamburger exchange rate comes out lower than the actual rate, that country’s currency is seen as undervalued.
Limits and Variations of the Big Mac Index

The Big Mac Index is fun and intuitive, but there are many reasons not to take it at face value.
(1) Big Macs cannot be exported or imported
The price of a hamburger includes large costs, such as rent and labor, that cannot be traded between countries. So price differences are not necessarily just a matter of currency. Big Macs tend to be cheaper in countries where land and wages are cheap.
(2) The Big Mac’s position differs from country to country
In some countries, McDonald’s is a pricier meal out than local restaurants, so demand is low, and taxes, competition, and pricing strategies also vary. In India, where many people do not eat beef, the chicken-based ‘Chicken Maharaja Mac’ is compared instead of the Big Mac.
(3) Prices were once held down artificially
Around 2011, when the Argentine government was suspected of understating its inflation figures, reports kept appearing that local McDonald’s restaurants were selling Big Macs unusually cheaply. Suspicions arose that the government had pushed prices down to make the index look better, and in June 2012, after the media reports, the price of a Big Mac meal suddenly rose by 26%.
(4) Many similar indexes have appeared
In January 2004, The Economist introduced the ‘Tall Latte Index,’ which uses Starbucks coffee instead, and Bloomberg created the ‘Billy Index,’ which compares the price of IKEA’s Billy bookcase. In Africa, where there are few McDonald’s restaurants, a ‘KFC Index’ using the price of KFC chicken has also emerged.
The Big Mac Index is less a tool for predicting exchange rates precisely than a thinking tool that puts a difficult theory within anyone’s reach. The fact that a single familiar hamburger can give a sense of the big currents of the world economy is why this index has remained popular for so long.
Taking a moment to think about the value of money hidden behind an unfamiliar price tag on a trip is the first step in the economics of understanding exchange rates.