
Suppose a local newspaper runs a story saying, “The higher an area’s income, the higher its support for a particular party.” Many readers will naturally conclude, “So rich people like that party.” Yet when you actually survey people one by one, you can sometimes get the exact opposite result. This illusion, which arises when numbers about a group are transferred directly onto individuals, is called the ‘ecological fallacy.’
Put simply, the ecological fallacy is the mistake of inferring that a conclusion drawn from data gathered at the level of groups, such as regions, countries, or schools, holds just as well for the individuals who belong to those groups. Here the word ‘ecological’ does not refer to biology; it is a statistical term for group-level data about the collectives surrounding individuals.
In this article, we will look in turn at how the name ecological fallacy came about, the principle by which group data and individual data diverge, examples we often come across in real life, and ways to avoid this trap.
Why Numbers About a Group Cannot Stand In for Individuals
How the Name ‘Ecological Fallacy’ Began

The ecological fallacy became widely known when a sociologist recalculated data from the US census.
(1) Robinson’s 1950 Paper
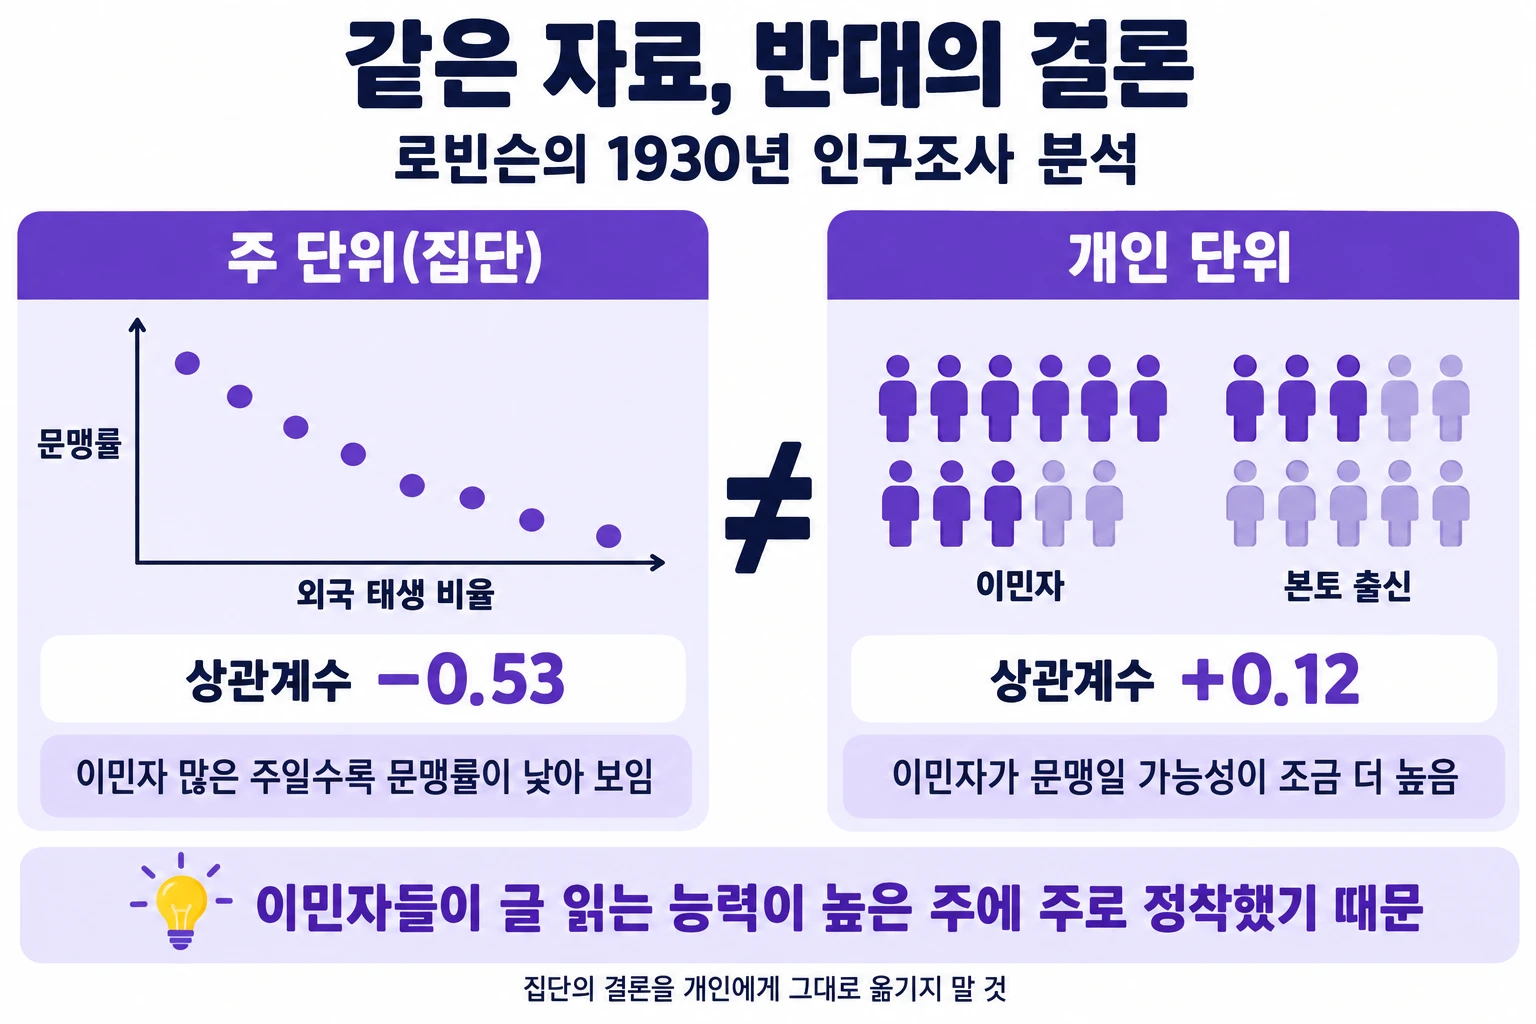
American sociologist William S. Robinson used data from the 1930 census to compare, state by state, the share of the population born abroad with the illiteracy rate. At the state level, states with more immigrants actually appeared to have lower illiteracy rates. But when he recalculated at the individual level, the result pointed the opposite way: immigrants were slightly more likely than the native-born to be illiterate. The state-level correlation coefficient was minus 0.53, while the individual-level correlation coefficient was plus 0.12. In 2011, a reanalysis found that some of the data Robinson used in his state-level calculation were wrong and that the correct value was minus 0.46, but the key point, that the direction reverses, still stands.
(2) Why the Results Diverge
Robinson explained that this difference arose because immigrants tended to settle in states where native-born residents had high reading ability. In effect, the characteristics of the group masked the characteristics of individuals.
(3) How It Got Its Name
Robinson warned against judging individuals from group data, and the person who gave this illusion the name ‘ecological fallacy’ was the statistician Hanan Selvin, in 1958.
The Principle by Which Group Data and Individual Data Diverge

A group’s average or proportion lumps many people’s values into a single figure, so it does not show how individuals are spread out within the group.
(1) Correlations at Different Levels
A correlation calculated at the group level is called an ecological correlation. This value can differ from the individual-level correlation not only in size but even in direction.
(2) A Higher Average Does Not Mean Higher Odds
Suppose that in group A, 80% score 40 points and 20% score 95, for an average of 51, while in group B, half score 45 and half score 55, for an average of 50. Group A has the higher average, but if you pick one person from each group and compare them, the person from B scores higher 80% of the time.
(3) Effects Created by the Group Itself
When an individual’s behavior is influenced not only by their own circumstances but also by the atmosphere of the surrounding group, the relationship at the group level and the relationship at the individual level can look different from each other.
Simpson’s paradox, in which a trend reverses the moment groups are combined or split, is a phenomenon with the same roots, and in statistics it is sometimes treated as a branch of the ecological fallacy. In the end, the key point is that the level at which data are grouped can change the conclusion itself.
The Ecological Fallacy in Everyday Life

The ecological fallacy lurks everywhere, in the news, in research, and in everyday conversation.
- Rich states and rich voters: In the 2004 US presidential election, Bush won the 15 poorest states, while Kerry won 9 of the 11 richest states. Yet at the individual level, 62% of voters earning more than $200,000 a year voted for Bush, a far higher share than among lower-income voters.
- Durkheim’s study of suicide: Taking the finding that suicide rates were higher in regions with more Protestants and concluding that individual Protestants are at greater risk is often cited as a classic example of the ecological fallacy.
- Diet and health by country: The fact that average life expectancy is long in a country where people eat a lot of a certain food does not mean that people who eat that food live longer.
As these examples show, the same data can tell completely different stories depending on the level from which you view them.
How to Avoid the Ecological Fallacy
To avoid the ecological fallacy, you should first check the level at which the data were collected before drawing a conclusion.
(1) Match the Level of the Question and the Data
If you want to learn about individuals, use individual data; if you want to learn about regions or countries, use group data. The moment the level of the question and the level of the data are out of step, an opening appears for the fallacy to slip in.
(2) Analyses That Look at Several Levels Together
Statistical techniques that put both levels into a single model to tell them apart are also used, such as multilevel analysis, which weighs the effects of individuals and groups at the same time.
(3) Beware the Trap in the Opposite Direction
There is also the reverse mistake of looking only at individual data and drawing firm conclusions about the characteristics of an entire group. This is called the atomistic fallacy, and it is the counterpart concept to the ecological fallacy.
The ecological fallacy is an illusion that arises not because the numbers are wrong but because the level at which we read them is off. A group’s average describes the group; it does not speak for any one person within it.
Every time you look at statistics, first ask what unit these numbers were gathered by. That is the first step toward interpreting data correctly.