
In statistics, confidence levels and confidence intervals play an important role in interpreting data and making decisions. These two concepts are used to assess how much we can trust the data we have collected, and they are widely applied in practice across many fields.
This article takes an in-depth look at the definitions of and differences between confidence levels and confidence intervals, how they are calculated and what they mean statistically, examples of their practical application, and the points to keep in mind and limitations when interpreting them.
Definitions of Confidence Level and Confidence Interval and How They Differ
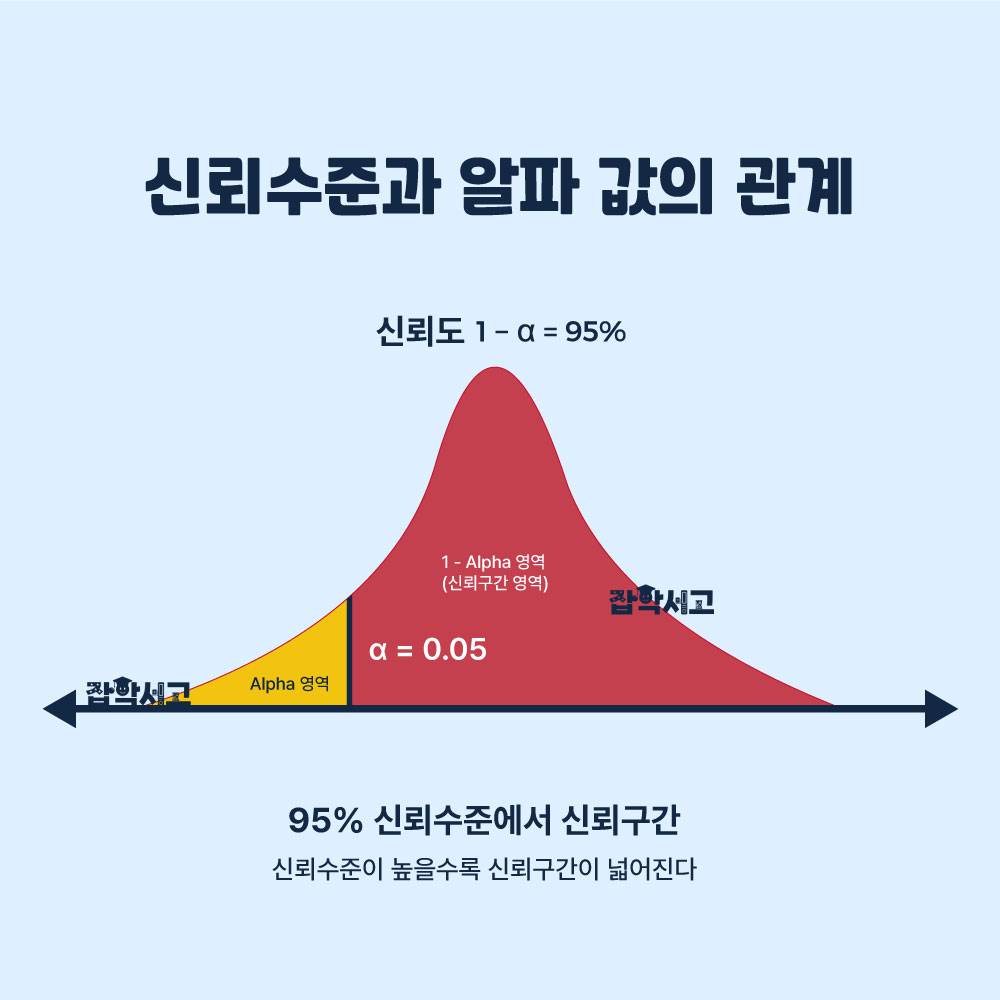 Conceptual diagram of the relationship between confidence level and alpha
Definition of Confidence Level
The confidence level represents the proportion of confidence intervals that contain the parameter when such intervals are constructed repeatedly using the same method. It is generally expressed as a value such as 90%, 95%, or 99%. For example, a confidence level of 95% means that if you drew a sample 100 times using the same method and constructed a confidence interval each time, about 95 of those intervals would contain the parameter.
Definition of Confidence Interval
A confidence interval is the range expected to contain the parameter at a given confidence level. It is defined as the sample mean plus a certain range around it, and the proportion of intervals constructed in this way that contain the parameter corresponds to the confidence level. For example, if a survey finds that the 95% confidence interval for average height is 160 cm to 170 cm, this means that if samples were drawn many times using the same method and an interval constructed each time, about 95% of those intervals would contain the population mean; in other words, we estimate with 95% confidence that the population mean lies within this range.
Differences Between Confidence Level and Confidence Interval
Confidence levels and confidence intervals are closely related but conceptually different. The confidence level is a probabilistic concept that indicates how often confidence intervals contain the true value. A confidence interval, on the other hand, is an interval actually calculated, referring to the range expected to contain the parameter under a specific confidence level.
The Importance of Confidence Level and Confidence Interval
These two concepts play a very important role in statistical inference. The higher the confidence level, the wider the confidence interval, reflecting greater uncertainty. Conversely, when the confidence level is lowered, the confidence interval becomes narrower, but the probability of containing the true value also falls.
Why the Two Concepts Must Be Distinguished
In practice, it is important not to confuse these two concepts. Setting the confidence level incorrectly can lead to wrong conclusions, and failing to interpret the confidence interval correctly can lead to misunderstanding what the data mean. It is therefore essential to clearly understand the definitions of and differences between confidence levels and confidence intervals.
Interpreting the Width of a Confidence Interval
Finally, a wider confidence interval indicates greater uncertainty in the estimate, which may suggest that more samples or more precise measurements are needed. Conversely, a narrow confidence interval can indicate that the estimate is highly precise. It is important to keep these points in mind when interpreting confidence levels and confidence intervals.
How to Calculate a Confidence Interval and What It Means Statistically
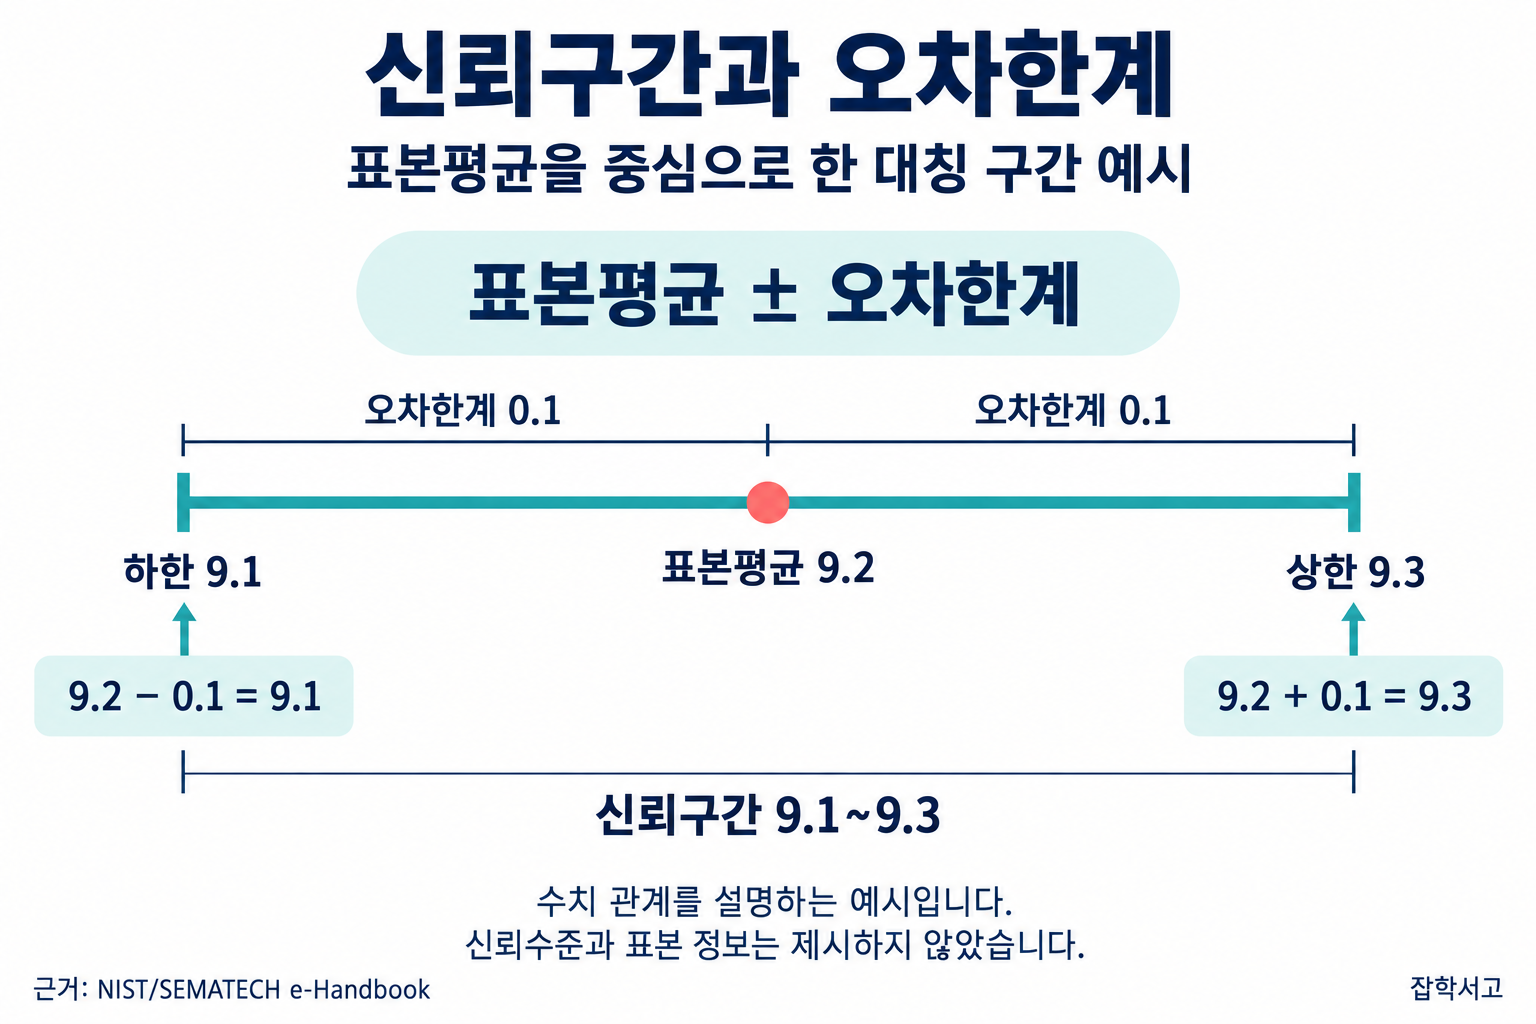
Basic Principles of Calculating a Confidence Interval
Calculating a confidence interval is relatively simple, but it requires accurate understanding and execution. In general, a confidence interval is calculated based on the sample mean, the standard error, and the confidence level. Mathematically, it can be expressed as follows.
- Confidence interval = sample mean ± (critical value × standard error)
Here, the critical value is the value corresponding to the chosen confidence level and can generally be obtained from the Z-distribution or the t-distribution.
Calculating the Sample Mean and Standard Error
To calculate a confidence interval, you first need to find the sample mean. This is the average of the collected data and represents a typical value for the whole data set. Next, you calculate the standard error. The standard error represents the variability of the sample and is obtained by dividing the sample standard deviation by the square root of the sample size.
Sample mean (x̄) = (Σ xi) / n
- x̄: sample mean
- Σ xi: sum of all sample values
- n: number of samples
Standard error (SE) = s / √n
- SE: standard error
- s: sample standard deviation
- n: number of samples
Determining the Critical Value
The critical value can be found using statistical tables. For example, at a 95% confidence level, the critical value from the Z-distribution is about 1.96. This means that if you repeatedly construct intervals extending ±1.96 standard errors from the sample mean, about 95% of them will contain the population mean.
The Statistical Meaning of a Confidence Interval
The statistical meaning of a confidence interval is very important. It represents the proportion of intervals that contain the parameter when intervals are estimated repeatedly using the same method, and it serves as an important criterion for assessing the reliability of the data. A narrower confidence interval indicates a more precise estimate, which allows for more confident judgments.
Width of the Confidence Interval and Data Variability
The width of a confidence interval is strongly influenced by the sample size and the variability of the sample. The larger the sample size, the smaller the standard error, which narrows the confidence interval. Conversely, if the sample is highly variable, the standard error grows and the confidence interval widens. When calculating a confidence interval, it is therefore important to secure a sufficient sample size and low variability.
The Role of Confidence Intervals in Hypothesis Testing
Confidence intervals also play an important role in statistical hypothesis testing. For example, if a confidence interval in a hypothesis test does not contain a specific value, the null hypothesis is rejected and the alternative hypothesis is adopted. This shows that a confidence interval does more than serve as a simple estimation tool.
Application and Interpretation in Practice
In practice, it is very important to calculate and interpret confidence intervals accurately. Setting a confidence interval incorrectly can cause errors in data interpretation, which can lead to poor decisions. When interpreting a confidence interval, you should therefore proceed carefully, taking the sample size and variability into account.
Examples of Applying Confidence Levels and Confidence Intervals in Practice
 How are confidence levels and confidence intervals applied?
Use of Confidence Intervals in Medical Research
In practice, confidence levels and confidence intervals are used in a wide range of fields. In medical research, for example, confidence intervals are used when evaluating the effect of a new drug to determine whether the drug's effect is statistically significant. A wide confidence interval means the drug's effect is uncertain, while a narrow one means it can be trusted more.
Application in Business
In business, confidence intervals are set through customer satisfaction surveys. For example, if customer satisfaction with a particular product has a 95% confidence interval of 70% ± 5%, this means you can estimate with 95% confidence that actual satisfaction lies between 65% and 75%. This becomes an important reference in the decision-making process.
Process Control in Manufacturing
In manufacturing, confidence intervals are used in process control. When evaluating product quality, a confidence interval is set to check whether the process mean meets the standard. For example, if the 95% confidence interval for the mean length of a product is 100 cm ± 2 cm, you can estimate with 95% confidence that the mean length lies between 98 cm and 102 cm. Because this interval concerns the mean, individual products may still fall outside this range.
Importance in Finance
Confidence levels and confidence intervals are also important in finance. For example, when forecasting investment returns, confidence intervals are used to assess the accuracy of the forecast. If the 95% confidence interval is 5% to 10%, it means you can estimate with 95% confidence that the average return lies within this range. This becomes an important reference when making investment decisions.
Interpretation in Social Science Research
In social science research, confidence intervals are used when interpreting survey results. For example, if approval of a particular policy has a 95% confidence interval of 60% ± 3%, it means you can estimate with 95% confidence that actual approval lies between 57% and 63%. This provides important information for making policy decisions.
Data Analysis in Environmental Science
In environmental science, confidence levels and confidence intervals are used to analyze environmental data. For example, if the concentration of an air pollutant has a 95% confidence interval of 50 ppm ± 5 ppm, it means you can estimate with 95% confidence that the actual mean concentration lies between 45 ppm and 55 ppm. This plays an important role in setting environmental policy.
In this way, confidence levels and confidence intervals play an important role in many fields, including medicine, business, manufacturing, finance, the social sciences, and environmental science, and serve as key tools for assessing the reliability of data and making decisions.
Points to Keep in Mind and Limitations When Interpreting Confidence Intervals
 What should you watch out for when interpreting confidence intervals?
Checking Sample Size and Representativeness
There are several points to keep in mind when interpreting a confidence interval. First, because a confidence interval is an estimate based on sample data, you need to check that the sample is large enough and representative. A small sample size widens the confidence interval and can increase uncertainty.
Reviewing Whether the Confidence Level Is Appropriate
Second, because a confidence interval is calculated under a specific confidence level, you need to review whether that confidence level is appropriate. An excessive confidence level can make the confidence interval so wide that it loses practical meaning. Conversely, a confidence level that is too low makes the confidence interval narrow and increases the probability that it fails to contain the true value.
Limitation of Confidence Intervals: They Reflect Only Statistical Uncertainty
Third, a confidence interval reflects only statistical uncertainty. It therefore does not reflect other forms of uncertainty or error, such as measurement error or systematic error. This is one of the important limitations in interpreting confidence intervals.
The Need for Repeated Measurements
In addition, because a confidence interval is calculated from a single sample, repeated measurements may be needed. It is necessary to check the consistency of the confidence interval through multiple measurements. This helps increase the reliability of statistical estimation.
The Probabilistic Meaning of a Confidence Interval
Finally, a confidence interval expresses the probability of containing the parameter, but this probability refers to the confidence interval itself, not to the actual parameter. In other words, saying there is a 95% probability that a confidence interval contains the true value means that if you drew countless samples and calculated a confidence interval for each, 95% of them would contain the true value. This is an important point in interpreting confidence intervals.
In conclusion, interpreting a confidence interval requires considering the sample size, the confidence level, the types of error, and so on, which is important for improving the accuracy and practical meaning of the confidence interval. Interpreting confidence intervals with these points in mind helps improve the accuracy and reliability of data.
Confidence levels and confidence intervals play a key role in statistical inference and are used in practice in many fields. Understanding and applying these two concepts correctly is very important for making data-driven decisions.
By clearly understanding the definitions of and differences between confidence levels and confidence intervals, how they are calculated, examples of their practical application, and the points to keep in mind and limitations when interpreting them, you will be able to carry out more accurate and reliable statistical analysis.