Regression analysis is an important tool in statistics and data science, widely used for data prediction and analysis across various industries and research fields. By modeling and understanding relationships between variables, it greatly helps predict future outcomes, providing highly useful information for decision-making.
This material will cover the basic concepts of regression analysis and various regression techniques, along with their practical applications and limitations. Through this exploration, we aim to gain an in-depth understanding of why regression analysis has established itself as a core technique for data prediction.
Basic Concepts of Regression Analysis: An Important Tool in Statistics
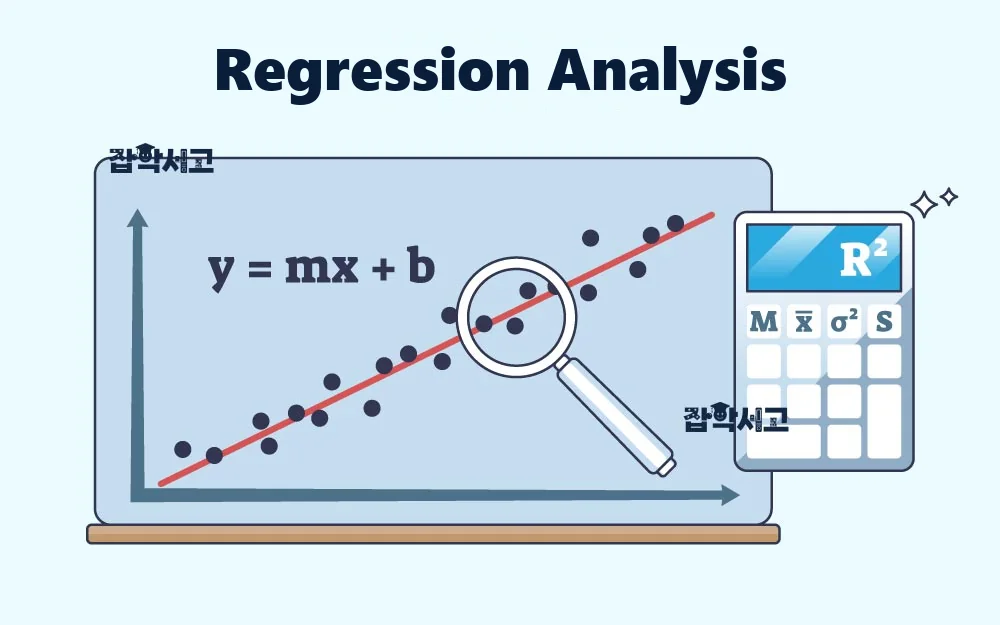
The Definition and Role of Regression Analysis
Regression analysis is a statistical method for explaining and predicting relationships between two or more variables. It is primarily used to predict changes in a dependent variable using one dependent variable and multiple independent variables. The main purposes of regression analysis are to explain relationships between variables and predict new observations. This makes it possible to understand patterns found within a dataset and identify how different variables interact. These analytical results serve as an important foundation for decision-making in fields such as economics, business management, and the social sciences.
The Importance of Data Collection and Preprocessing
The first step in building a regression model is to collect high-quality data. Data can be obtained from various sources, and its quality has a significant effect on the results of regression analysis. Data containing missing values or outliers can lead to incorrect analytical results, so preprocessing is essential after data collection. The data-cleaning process must address missing values, remove or correct outliers, and transform variables as needed to make the data suitable for analysis. Preparing reliable data through this process is an important step in improving the accuracy of the analysis.
The Least Squares Method: A Core Technique in Regression Analysis
One of the most widely used methods in regression analysis is the least squares method. The least squares method estimates parameters that minimize the differences between a model's predicted values and the actual observations. In other words, it determines the coefficients of a regression model so that the differences between the observed data and the values predicted by the model are as small as possible. This enables the model to better reflect trends in the data and can improve prediction accuracy. The least squares method is particularly common in linear regression models and is considered a mathematically simple yet effective method.
Testing Model Fit: Evaluating the Reliability of an Analysis
To evaluate how well a regression model works, its goodness of fit must be tested. Goodness-of-fit testing is the process of evaluating how well a model explains the data, using measures such as the coefficient of determination (R²). R² takes a value between 0 and 1, and the closer the value is to 1, the better the model explains the data. Conversely, a low R² value means that the model does not explain the data well. Through this testing process, analysts can assess the model's reliability and obtain the information needed to improve it when necessary.
Types and Applications of Regression Models
Regression analysis includes various types of regression models, and it is important to choose a suitable model according to the characteristics of the data. Representative regression models include linear regression and nonlinear regression. Linear regression is appropriate when the relationship between the independent and dependent variables follows a straight line, and it is mainly used when the data can be explained simply. Nonlinear regression, on the other hand, is used when the relationship between the independent and dependent variables takes a curved form and is useful for explaining complex data patterns.
Polynomial regression is an extension of linear regression and is used when the data follows a function of degree 2 or higher. In addition, logistic regression is used to predict binary dependent variables and is mainly applied to classification problems. Each regression model performs differently depending on the structure of the data, so choosing a model that matches the data's characteristics is very important.
Limitations of Regression Analysis and Methods for Improvement
Regression analysis is a powerful prediction tool, but it also has several limitations. First, regression models focus on explaining correlations between variables rather than causal relationships. In addition, when the data is nonlinear or contains outliers, the model's predictive power can decline significantly. To address these problems, methods such as variable selection, regularization techniques, and nonlinear transformations can be considered. Residual analysis can also be used to examine the model's prediction errors and assess opportunities for improvement. These processes can increase the accuracy of the analysis and produce more reliable results.
Analyzing the Differences Between Linear and Nonlinear Regression

The Definition and Characteristics of Linear Regression
Linear regression is the most basic and widely used method in regression analysis, assuming a linear relationship between the independent and dependent variables. In other words, the dependent variable is expressed as a linear combination of the independent variables, usually in an equation of the form y = ax + b. Here, 'a' is the slope representing the influence of the independent variable, and 'b' is the intercept on the y-axis. Linear regression is useful for identifying overall trends in the data, and its simple calculations and ease of interpretation allow results to be obtained quickly.
This model is widely used in fields such as economics, the social sciences, and biology, and it is effective when the relationship between the independent and dependent variables is relatively simple. However, when data patterns are complex or nonlinear, linear regression has the limitation of being unable to provide sufficient explanatory power.
The Definition and Characteristics of Nonlinear Regression
Nonlinear regression is a regression model used when the relationship between the independent and dependent variables is nonlinear. This model can use various functional forms to explain complex patterns and is suitable when the data is distributed along a curve. Nonlinear regression can include terms of different degrees, as in y = ax² + bx + c, and sometimes takes nonlinear forms such as exponential or logarithmic functions.
Nonlinear regression excels at explaining complexities in the data that linear regression cannot explain, but its calculations can be correspondingly complex and its interpretation difficult. There is also a risk of overfitting if the model fits the data too sensitively. To prevent this, regularization techniques that adjust the model's complexity can be applied.
Key Differences Between Linear and Nonlinear Regression
Linear and nonlinear regression differ significantly in how they explain the relationship between the independent and dependent variables. Linear regression is used when the relationship between the independent and dependent variables follows a straight line, and although it is easy to interpret and quick to calculate, it has limitations in explaining complex data patterns. Nonlinear regression, on the other hand, offers the flexibility to explain complex patterns in the data and can model complex relationships using various functional forms.
However, nonlinear regression has the disadvantages of being difficult to interpret and carrying a risk of overfitting. To address these issues, regularization techniques can be applied to control model complexity and improve predictive performance.
Model Fit Testing and Differences
The fit of a linear regression model can be evaluated using simple measures such as the coefficient of determination (R²). A higher R² value is considered to indicate that the model explains the data well. However, for nonlinear regression, evaluating model fit can be more complex and requires various goodness-of-fit testing techniques. For example, model performance can be evaluated through residual analysis or measures such as AIC (Akaike Information Criterion).
Criteria for Choosing Between Linear and Nonlinear Regression
In data analysis, the choice between linear and nonlinear regression depends on the characteristics of the data and the purpose of the analysis. Linear regression is useful when the aim is to explain simple relationships and is suitable for identifying overall trends in the data. On the other hand, nonlinear regression may be more appropriate when the data exhibits nonlinear characteristics or complex relationships need to be explained.
Data scientists and statisticians must understand the characteristics and limitations of these models and choose the model best suited to the data. Choosing an appropriate model helps improve prediction accuracy and better explain patterns in the data.
Applications and Considerations for Linear and Nonlinear Regression
Linear and nonlinear regression each have advantages and disadvantages, and the appropriate model should be selected according to the structure of the data and the purpose of the analysis. Linear regression is simple and easy to interpret, while nonlinear regression offers the flexibility to explain complex data patterns. When choosing a model, the characteristics of the data, the risk of overfitting, and the model's interpretability must all be considered.
Practical Examples of Data Prediction Using Regression Analysis

An Overview of Real-World Applications of Regression Analysis
Regression analysis contributes to solving practical problems in various industries, and its usefulness has been demonstrated across multiple fields. It serves as an important tool in situations requiring data-driven prediction and analysis, with a particularly significant influence in economics, finance, healthcare, marketing, transportation, and environmental fields. Various examples will provide a detailed look at how regression analysis helps solve real-world problems.
Using Regression Analysis in the Real Estate Market
In the real estate market, regression analysis is useful for predicting housing prices. By considering various independent variables, such as a home's size, location, age, and number of floors, to predict the dependent variable of housing price, it provides important information to real estate agents and buyers. For example, analyzing the prices at which homes with similar characteristics have sold makes it possible to predict the price at which a particular home is likely to sell in the future. This allows agents to propose reasonable prices and buyers to understand market conditions and make better decisions.
Regression Analysis in Financial Markets
In the financial industry, regression analysis also plays an important role in stock market analysis and risk management. It uses stock prices, trading volumes, economic indicators, and other factors as independent variables to predict stock price fluctuations, helping develop investment strategies. In particular, regression analysis using time-series data is effective at predicting future economic conditions based on historical data. Analyzing the effects of changes in economic indicators on stock prices and making investment decisions based on that analysis enables more strategic investment.
Applying Regression Analysis in Healthcare
In healthcare, regression analysis is also useful for predicting diseases and developing personalized treatment plans for patients. By combining data such as a patient's medical history, age, sex, and various test results to predict the likelihood of disease onset, it helps medical professionals identify more appropriate treatment methods. For example, identifying the effects of particular factors on disease occurrence through regression analysis enables preventive measures or early diagnosis, allowing patients' health to be managed more effectively.
Using Regression Analysis in Marketing
Regression analysis also makes a significant contribution to developing marketing strategies. By analyzing various data, such as consumers' purchasing patterns, ages, incomes, and preferences, it can predict future purchasing behavior. Based on this information, companies can develop effective marketing strategies and conduct personalized advertising campaigns. For example, predicting how consumer interest in a particular product will change makes it possible to allocate advertising budgets efficiently or adjust the timing of new product launches. This enables increased sales and optimized use of resources.
Applying Regression Analysis in Transportation and Logistics
In transportation, regression analysis helps predict traffic volumes and reduce traffic congestion. For example, analyzing changes in traffic volume according to particular times of day or weather conditions makes it possible to develop measures to ease road congestion. In delivery services, regression analysis can also predict delivery times, and providing customers with accurate delivery schedules based on this information can improve customer satisfaction. This can significantly improve the efficiency of transportation systems and logistics networks.
Predicting Climate Change and the Role of Regression Analysis
Regression analysis also plays an important role in climate change research. By analyzing climate data such as temperature, precipitation, and wind speed to predict future climate change, it helps policymakers develop environmental policies. For example, regression analysis can be used to analyze climate change patterns in a particular region and develop plans for agriculture, energy consumption, and disaster management accordingly. In this way, conducting regression analysis based on climate change data can contribute to environmental protection and the development of strategies for responding to climate change.
The Broad Applications and Value of Regression Analysis
Regression analysis has established itself as an important prediction tool across various fields, providing practical value in real estate, finance, healthcare, marketing, transportation, environmental fields, and more. It serves as an essential tool for solving problems and developing better strategies through data-driven decision-making. Using it appropriately enables more efficient and accurate prediction and analysis and can increase competitiveness in each industry.
Exploring the Limitations of Regression Analysis and Methods for Improving Accuracy
Limitations of Regression Analysis and the Importance of Assumptions
Regression analysis is a powerful tool for data analysis and prediction, but it has several important limitations. The first limitation is that regression analysis relies on specific assumptions about the data. In particular, linear regression assumes a linear relationship between the independent and dependent variables, and if this assumption is not met, the model's predictive power declines significantly. For example, when there is a nonlinear relationship between the independent and dependent variables, a linear regression model cannot explain it accurately and may lead to incorrect conclusions.
To overcome this, it is necessary to first check whether the data is linear and, if it lacks linearity, use a nonlinear regression model or another methodology. The independence of the independent variables, which is also an assumption of regression models, must be examined as well, and methods for addressing multicollinearity must be considered if it is present, because it can reduce model performance.
Handling Outliers and Ensuring Model Reliability
Another prominent limitation of regression analysis is the presence of outliers. An outlier is a point in the data with an extreme value compared with other observations and can negatively affect the performance of a regression model. Data containing outliers is likely to distort the model and make its predictions inaccurate.
One method for identifying and handling outliers is residual analysis. Residuals are the differences between the values predicted by the model and the actual observations, and residual analysis can identify which data points are outliers. Removing outliers or adjusting them as needed can ensure the model's reliability.
Variable Selection and Model Simplification
Appropriate variable selection is very important for improving model performance. Not every independent variable has a meaningful effect on the dependent variable, and including unnecessary variables can lead to overfitting. Overfitting occurs when a model is fitted too closely to the training data, reducing its predictive performance on new data.
Variable selection techniques include forward selection, backward elimination, and stepwise selection. These techniques help improve predictive performance by reducing model complexity while retaining only important variables. This makes it possible to build a simpler, interpretable model.
Preventing Overfitting Through Regularization Techniques
Another way to prevent overfitting in regression analysis is to use regularization techniques. Regularization techniques help prevent overfitting and improve predictive performance by adjusting model complexity. Representative regularization methods include Lasso and Ridge regression.
Lasso regression can achieve a variable selection effect by setting the coefficients of unnecessary variables to 0, while Ridge regression works by limiting coefficient magnitudes to reduce overfitting. These techniques can be used selectively according to the characteristics of the data, improving model interpretability while maintaining prediction accuracy.
Evaluating Models Through Cross-Validation
Cross-validation is frequently used to evaluate model performance objectively. Cross-validation divides the data into several parts and repeats training and validation to evaluate how well a model can generalize to new data. This helps prevent overfitting and makes it possible to build models that perform consistently across various data conditions.
One of the most common methods of cross-validation is k-fold cross-validation (k-fold cross-validation), which divides the data into k folds and uses each one for validation in turn. This method is particularly useful when the amount of data is small or there are concerns about overfitting.
Using the Latest Techniques and Tools
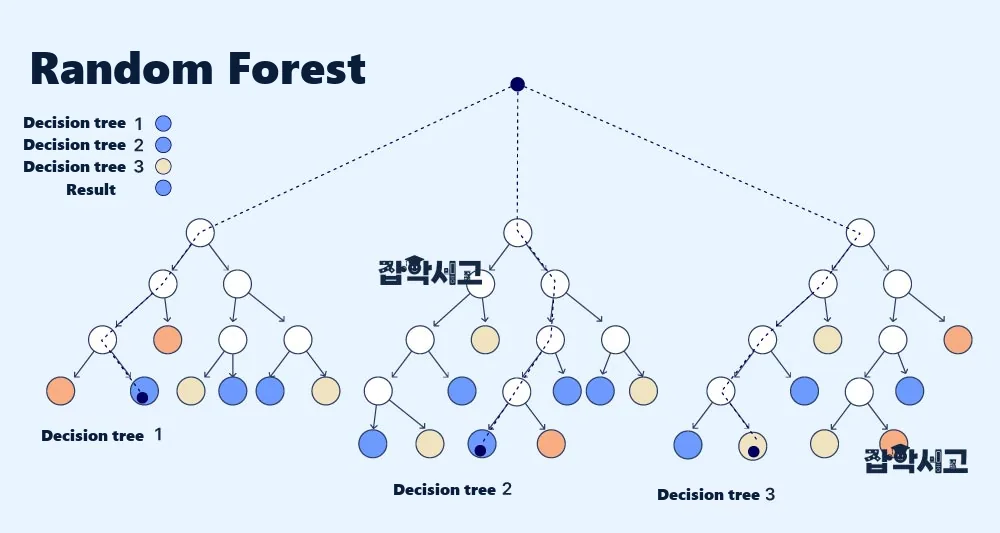
Using the latest techniques and tools is also important for improving the accuracy of regression analysis. As machine learning advances, regression analysis techniques are also becoming more sophisticated. For example, machine-learning-based regression models, such as random forest regression and support vector regression, complement conventional regression analysis and enable more accurate predictions.
Data scientists can use these latest tools appropriately to achieve better results in data analysis and prediction and maximize the insights provided by regression analysis.
Limitations of Regression Analysis and Approaches to Improvement
Regression analysis is a powerful prediction tool, but it is important to recognize its limitations and apply various methodologies to address them. Understanding the characteristics of the data and selecting appropriate variables and handling outliers can improve model performance, while regularization techniques and cross-validation can prevent overfitting and increase accuracy. Continually learning and applying the latest techniques will make it possible to realize the full potential of regression analysis.
Regression analysis has established itself as an essential technique for data prediction, and its usefulness is widely recognized across various fields. Understanding the differences between linear and nonlinear regression and examining practical examples can demonstrate the value of this technique. However, regression analysis has several limitations, and various studies and approaches exist to address them.
Data scientists and analysts must recognize these limitations and seek appropriate alternatives to perform more reliable prediction and analysis. Regression analysis is expected to continue developing as an important tool for data-driven decision-making, with its range of applications expanding further.