
Inferential statistics is a methodology that plays a very important role in analyzing and interpreting data. It is a statistical technique that uses sample data to draw conclusions about a population, providing key principles and techniques that support data-driven decision-making.
This material explains the basic concepts of inferential statistics and discusses its role and importance in data analysis. It also explores how to use inferential statistics effectively through major techniques and practical examples, and aims to present ways to apply it in everyday life.
Basic Concepts of Inferential Statistics

Definition of Inferential Statistics
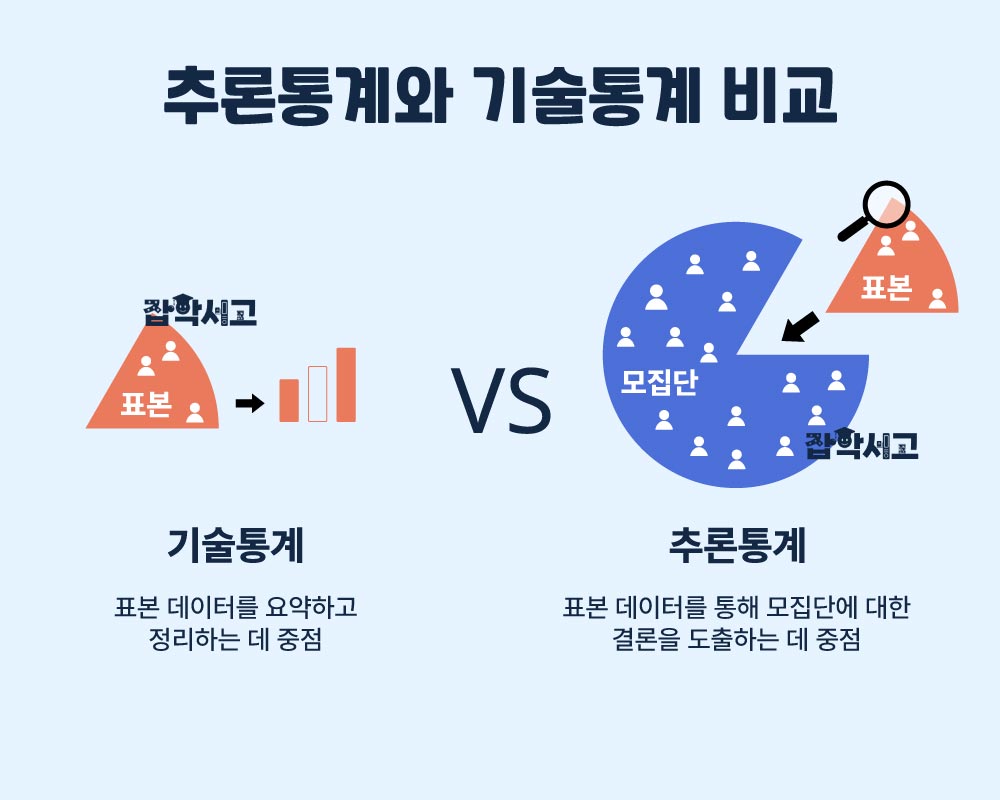
Inferential statistics refers to statistical techniques that analyze sample data to draw conclusions about a population. A population is the entire group of interest in a study or analysis, while a sample is a subset of data drawn from that population. For example, university students nationwide can be defined as the population, and students from a particular university can be used as a sample for data analysis. The purpose of inferential statistics is to estimate the characteristics of a population using such sample data and make decisions based on those estimates.
The Difference Between Sample Statistics and Parameters
Important concepts in inferential statistics include 'sample statistics' and 'parameters.' Sample statistics are values calculated from a sample and are used to estimate the characteristics of a population. For example, a sample mean can be used to estimate a population mean. In contrast, parameters are values that describe the characteristics of the population itself and cannot be measured directly through a sample. Therefore, the process of estimating parameters using sample statistics can be considered the core of inferential statistics.
Point Estimation and Interval Estimation
Major techniques in inferential statistics include 'point estimation' and 'interval estimation.' Point estimation is a method of estimating a population parameter using a single value. For example, using a sample mean to estimate a population mean as a single value is a form of point estimation. However, point estimation has the limitation that it may not always be accurate.
A method that addresses this limitation is 'interval estimation.' Interval estimation indicates the likelihood that a parameter falls within a specific range, providing more reliable information than point estimation. For example, calculating the probability that a population mean falls within a specific range at a 95% confidence level is a form of interval estimation. Interval estimation is used more frequently in practice because it clearly indicates how much uncertainty an estimate has.
The Importance of Hypothesis Testing
Another important procedure in inferential statistics is 'hypothesis testing.' This is the process of comparing two or more hypotheses and using statistical methods to accept or reject one of them. Hypothesis testing is a powerful tool that can provide clear answers to research questions and is essential in various studies and experiments. Hypothesis testing is generally carried out by establishing a null hypothesis and an alternative hypothesis, then determining whether there is statistical evidence sufficient to reject the null hypothesis. It can be used in many fields, including corporate market research and medical experiments.
Margin of Error and Confidence Intervals
Inferential statistics focuses on providing interpretations that account for uncertainty in data. Representative concepts include the 'margin of error' and 'confidence interval.' The margin of error indicates how far a sample statistic may deviate from the actual parameter and is an important indicator of the reliability of analytical results.
A confidence interval is a range that indicates the likelihood that a parameter falls within a particular interval, and 95% confidence intervals are commonly used. It helps reduce uncertainty when estimating population characteristics and contributes to drawing more reliable conclusions. Confidence intervals and margins of error play important roles when making decisions through data analysis.
Everyday Applications of Inferential Statistics
Inferential statistics is also widely used in everyday life. For example, estimating support for a candidate through opinion polls during an election is a representative example of inferential statistics. When companies investigate market reactions to a new product, inferential statistics is also used to predict the responses of all consumers based on sample surveys. In medicine, this technique is frequently used in studies that test the effects of drugs or estimate the probability of disease occurrence.
Ultimately, inferential statistics is an essential tool that helps people draw conclusions from data and make better decisions in various fields. Using it appropriately enables a more scientific and systematic approach.
The Role and Importance of Inferential Statistics in Data Analysis
The Role of Inferential Statistics
Inferential statistics is an essential tool in data analysis, using sample data to draw conclusions about a population. It focuses on gaining meaningful insights from data, predicting the future, and managing uncertainty. While descriptive statistics is limited to summarizing data, inferential statistics provides analytical methods for making predictions and decisions about a population based on data.
Basic Statistics for Understanding Data Characteristics
At the initial stage of data analysis, inferential statistics is used to estimate basic population statistics, such as the mean, variance, and standard deviation, using sample data. These basic statistics play an important role in understanding the overall characteristics of data and serve as a starting point for analysis. For example, the mean can be used to identify the median, while variance and standard deviation can be used to evaluate the variability of data. This enables analysts to understand the distribution and characteristics of data and draw initial conclusions.
The Foundation of Data Analysis Techniques
Inferential statistics forms the foundation of various data analysis techniques. Techniques such as regression analysis, analysis of variance (ANOVA), and k-means clustering all rely on inferential statistics to interpret data and discover meaningful patterns and relationships. These techniques can provide important insights into complex data and support practical decision-making. For example, regression analysis plays an important role in identifying relationships between variables and is used to predict outcomes that are likely to occur in the future.
An Essential Tool for Data-Driven Decision-Making
Inferential statistics plays a central role in decisions based on data. Companies use inferential statistics to make strategic decisions in various business areas, including sales forecasting, customer segmentation, and market analysis. This provides more reliable results because the decisions are based on evidence from data rather than simple estimates. It enables companies to strengthen their competitiveness and secure a favorable position in the market.
Its Role in Predictive Analytics
Inferential statistics also plays an important role in predictive analytics. Predictive models that forecast the future based on historical data are built on inferential statistics, and these models are used to learn from and analyze data to predict future trends. In particular, fields such as machine learning process and learn from large amounts of data, then use inferential statistics to produce accurate predictions. This supports important decisions in various industries, including finance, marketing, and manufacturing.
Applications in Public Policy and Social Research
Inferential statistics is also widely used in public policy and social research. Inferential statistical techniques are used in opinion polling, the analysis of social phenomena, and economic indicator analysis to obtain important insights and make policy decisions based on them. For example, governments can collect public opinions through opinion polls and analyze the results to set policy directions. This contributes to promoting the interests of society as a whole and improving policy effectiveness.
Inferential Statistics for Improving Research Reliability
Scientific research uses inferential statistics to assess research reliability and draw conclusions. Hypothesis testing and confidence interval analysis are key tools for judging the reliability of research findings, enabling researchers to assess how trustworthy their results are. This is an important factor in improving research quality and contributing to academic progress. Through accurate statistical analysis, scientific research can present clearer and more reliable conclusions.
Inferential statistics is a powerful tool that goes beyond analyzing data to support prediction and decision-making. It is used in various industries and research fields and plays an essential role in making reliable decisions based on data. Understanding inferential statistics well and using it appropriately is an important factor in achieving better outcomes in modern society.
Major Techniques in Inferential Statistics

Inferential statistics analyzes and interprets data through various techniques, each of which is used in particular situations. These techniques support data-driven decision-making and serve as practical tools for solving problems. This section introduces representative inferential statistical techniques and examples of their practical applications.
t-Test (t-test): Analyzing Differences in Means Between Two Groups
The t-test is a representative statistical technique for comparing differences in means between two groups. It is mainly used with small samples when the population variance is unknown. For example, when evaluating the effects of a new drug, its efficacy can be verified by analyzing the difference in means between the treatment group and the control group. This test is widely used in various experiments as well as academic research. Another example is using a t-test to compare whether a new learning program is more effective than an existing program.
Chi-Square Test (Chi-square test): Analyzing Categorical Data
The chi-square test is a method for testing differences between observed and expected frequencies in categorical data. This technique is frequently used to analyze the effects of marketing campaigns. For example, a campaign's success can be statistically verified by evaluating whether customer behavior changes before and after the campaign. This enables companies to analyze the efficiency of their marketing strategies and incorporate the findings into future decisions. The chi-square test is also an important technique frequently used in social science and psychology research.
Regression Analysis (Regression analysis): Analyzing Relationships Between Variables and Making Predictions
Regression analysis is a technique for building predictive models by analyzing relationships between independent and dependent variables. Linear regression is a representative approach to modeling a linear relationship between two variables and is useful, for example, when analyzing the relationship between advertising expenditure and sales. Companies can use it to predict how an advertising budget affects sales and develop efficient advertising strategies. Regression analysis enables data-driven predictions in various fields, including economics, marketing, and engineering.
Analysis of Variance (ANOVA): Comparing the Means of Three or More Groups
Analysis of variance is a statistical technique for comparing differences in means among three or more groups. It is used to test differences between groups by analyzing data from multiple groups simultaneously. For example, when comparing the effects of various educational programs, the most effective program can be identified by analyzing academic achievement in each group. This enables educational institutions to adopt more effective teaching methods, and analysis of variance is frequently used in experimental design.
Logistic Regression (Logistic regression): Predicting Binary Variables
Logistic regression is a regression technique used when the dependent variable is binary, meaning it takes one of two possible values. For example, logistic regression can be used to predict whether a customer will make a purchase. By analyzing customers' demographic information and past purchase histories, it is possible to predict the likelihood that they will buy a product and develop customized marketing strategies based on those predictions. Logistic regression is used as an important predictive tool in medicine, finance, and marketing.
Survival Analysis (Survival analysis): Analyzing Events Over Time
Survival analysis is a technique for analyzing the occurrence of events over time and is mainly used in biotechnology and quality control. For example, it is used to predict the survival time of patients who have received a particular treatment or to analyze when a product will fail. This enables medical research to evaluate the efficacy of treatments and allows companies to gain insights for improving product durability. Survival analysis is a very useful tool for interpreting data that arise over time.
The various techniques of inferential statistics play a major role in analyzing and interpreting data appropriately for each situation. These techniques can be used to gain meaningful insights from data and contribute to solving practical problems. Each technique is useful for particular applications and makes data-driven decision-making more refined.
Data Analysis Methods Using Inferential Statistics in Different Fields

Personal Financial Management Using Inferential Statistics
In personal financial management, inferential statistics is useful for managing budgets effectively. Analyzing monthly spending data makes it possible to predict future spending patterns and develop reasonable budget plans. For example, calculating the mean and standard deviation of spending based on historical data makes it possible to estimate the probability that future spending will fall within a particular range. This can help develop strategies to reduce unnecessary spending and maintain financial stability.
Data Analysis in Health Management
Inferential statistics can also contribute to developing personalized health management plans. For example, analyzing data on daily activity levels and eating habits makes it possible to predict changes in body weight or health indicators. This enables plans to be developed to improve or maintain future health and allows for personalized health management tailored to an individual's lifestyle patterns. In particular, preventive measures are also possible by comprehensively analyzing various health data to predict potential future health problems in advance.
Applications of Inferential Statistics in Education
In education, inferential statistics can be used to improve educational programs by analyzing students' learning outcomes. Test score data can be analyzed to evaluate the effects of a particular educational approach and optimize teaching methods. For example, analysis of variance (ANOVA) can be used to compare differences in outcomes among several educational approaches and select the most effective teaching method. This greatly helps in developing educational programs tailored to the individual characteristics of each learner.
Data Analysis for Optimizing Marketing Strategies
Inferential statistics also serves as an important tool in marketing. Analyzing customers' purchase records and demographic data makes it possible to identify target customers for a particular product and carry out customized marketing campaigns based on those findings. For example, logistic regression analysis can predict a customer's likelihood of making a purchase and help use marketing funds efficiently. In addition, customer segmentation and behavior prediction can be used to build personalized marketing strategies and maximize profits.
Inferential Statistics in Public Policy Development
Inferential statistics also plays a major role in public policy development. For example, analyzing traffic accident data makes it possible to estimate the probability of accidents in particular areas or at particular times and develop traffic safety policies based on those estimates. By using chi-square tests to analyze the causes of traffic accidents, more effective accident prevention measures can be developed. Such data-driven policy decisions contribute to improving public safety and welfare.
Data Analysis in Sports
Data analysis using inferential statistics is also actively conducted in sports. Analyzing athletes' competition records and physical fitness data makes it possible to predict future performance and optimize training plans. By using regression analysis to examine how particular factors affect competitive performance, strategic training plans can be developed to improve athletes' performance. Such analysis also contributes to developing team strategies and plays an important role in improving competitive performance.
Inferential statistics plays an important role in solving practical problems and making decisions in various fields. In areas such as personal financial management, health management, education, marketing, public policy, and sports, it makes it possible to analyze data, predict the future, and develop practical plans based on those predictions. The use of inferential statistics in each field is becoming established as an essential tool for making more scientific and reliable decisions.
Inferential statistics is an important tool for data analysis and decision-making and is widely used in various fields. Understanding its basic concepts and using its major techniques appropriately makes it possible to draw meaningful insights from data.
We hope that the various methods and examples introduced in this material provide a full appreciation of the importance and practical value of inferential statistics. Furthermore, we hope it helps you use inferential statistics to make better decisions in various situations, including everyday life and business.