Standard deviation plays an important role in describing data variability and is an essential concept used in a wide range of practical situations. In data analysis and decision-making, standard deviation provides a clearer understanding of how data is distributed, enabling more refined analysis.
This article explores the basic concept of standard deviation and how it can be used in practice. It also explains how to calculate standard deviation and apply it effectively in practical settings. Through this, it aims to present strategies for improving the efficiency of data analysis.
The Basic Concept and Importance of Standard Deviation
The Definition and Key Role of Standard Deviation
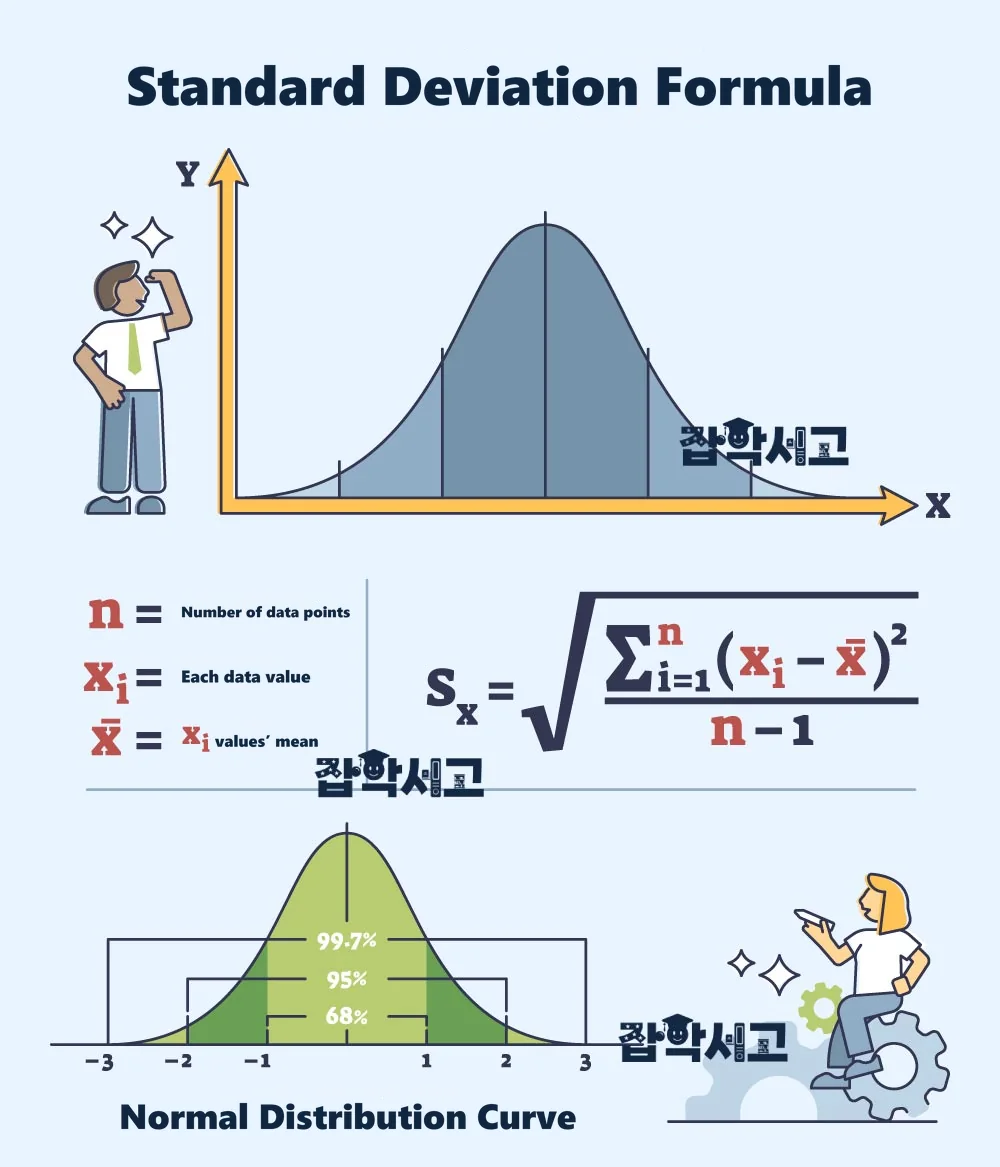
Standard deviation is an important measure of how widely data is spread around the mean. It is used to determine how far data values are from the mean, that is, their variability. A large standard deviation means that the data is spread widely around the mean, while a small value indicates that it is clustered near the mean. This allows the consistency and variability of the data to be evaluated.
For example, even if two regions have the same average income, their income distributions differ considerably if their standard deviations differ. Income may be relatively uniform in one region, while the other may have large income disparities. This provides insights beyond the average alone.
The Practical Importance of Standard Deviation
Standard deviation plays an important role across various fields in practice. For example, in finance, it is used to assess investment risk by measuring the volatility of stocks. A higher standard deviation means greater volatility in a stock's price, suggesting that investors may need to accept greater risk. In manufacturing, standard deviation is used for product quality control to maintain consistency in production processes. When product specifications remain consistent, standard deviation decreases, which is a positive sign for quality control.
Standard deviation is also useful for analyzing customers' purchasing patterns. If customer behavior is inconsistent, standard deviation can help identify different customer segments and develop tailored marketing strategies for them. This helps companies provide more personalized experiences to customers and maximize profits.
Standard Deviation Adds Depth to Data Interpretation
Standard deviation means more than a simple numerical value. When used alongside the mean, it can reveal the specific shape of a data distribution, allowing the data to be explained more clearly. For example, even if two regions have the same average income, their standard deviation values can clearly reveal differences in their income distributions. In this way, standard deviation forms a foundation for data analysis, and understanding it accurately is the starting point for all data interpretation.
Using Standard Deviation in Risk Management
Standard deviation is also used as an essential tool in risk management. Particularly in environments with high uncertainty, standard deviation can help identify potential risks in advance and develop responses to them. For example, if unexpected fluctuations occur during a project, standard deviation can be used to measure the magnitude of this variability in advance and prepare for it. This plays a very important role in supporting a company's stable growth.
Strategic Use in Practice
Applying standard deviation in practice allows a more accurate understanding of data characteristics and supports the development of better business strategies. For example, companies can identify variability in customer data to implement marketing tailored to specific segments, or make investment decisions based on stock market volatility. Standard deviation can also be used to manage quality variations during production and maintain consistent product quality.
Standard deviation plays a very important role in analyzing and interpreting data. Clearly understanding data variability and characteristics and applying this understanding effectively in practice enables better decision-making. Through this, companies can maximize practical results in various areas, including customer management, quality control, and risk management. Understanding and using standard deviation properly is an important key to successful data analysis and business performance.
Practical Examples of Standard Deviation in Data Analysis

Using Standard Deviation in Finance
In finance, standard deviation is a key tool for assessing investment risk. Calculating standard deviation from historical returns on assets such as stocks and funds allows their volatility to be determined. Higher volatility means greater risk, enabling investors to make more cautious investment decisions. For example, if one of two stocks has a large standard deviation, that stock is more likely to experience larger fluctuations, meaning that investors may need to accept greater risk. This analysis plays an important role in diversifying portfolios and is essential for investors seeking stable returns.
Quality Control in Manufacturing
In manufacturing, maintaining consistent product quality is very important. Standard deviation is used to check how closely the dimensions or weights of manufactured products meet target standards. A low standard deviation indicates that the products maintain almost identical quality, which is evidence of a stable production process. Conversely, a high standard deviation means that product quality varies considerably, allowing quality managers to identify and improve problems in the process. For example, if the standard deviation of a particular product's dimensions is high, there is a strong possibility of a problem with machine settings or material quality. By adjusting these promptly, companies can provide consumers with products of consistent quality.
Assessing Academic Performance in Education
In education, standard deviation plays an important role in analyzing the distribution of students' test scores. It can be used to evaluate test difficulty or the learning environment. A low standard deviation means that most students received scores close to the average, which may suggest that the test's difficulty was appropriate. Conversely, a high standard deviation means that there are large differences in scores among students, indicating that the test may have been too difficult or too easy. This allows educational institutions to adjust test fairness and difficulty to assess academic performance more accurately.
Analyzing Customer Behavior in Retail
In retail, standard deviation can be used to analyze customers' purchasing patterns and develop better marketing strategies. For example, analyzing how often customers purchase a particular product or the standard deviation of their purchase amounts can reveal how behavior differs among customer groups. Based on this, retailers can develop tailored promotions or discount strategies for specific customer groups, increasing customer satisfaction and sales. For example, if the frequency of purchases of a particular product is irregular, marketing measures can be developed to improve it.
Monitoring Health Status in Healthcare
In healthcare, standard deviation is used to continuously monitor patients' health status. For example, analyzing the standard deviation of blood pressure or blood glucose readings can reveal how much a patient's health status is fluctuating. A high standard deviation means that the readings are unstable, suggesting a possible abnormality in the patient's health. This allows healthcare professionals to develop personalized treatment plans and propose better approaches to health management. Regular measurements enable more accurate monitoring of changes in a patient's condition, helping prevent a deterioration in health.
Evaluating Performance in Sports
Standard deviation also plays an important role in analyzing athletes' performance in sports. Analyzing standard deviation based on athletes' competition records or statistical data allows the consistency and variability of their performance to be evaluated. A low standard deviation means that an athlete's performance is consistent, indicating stable concentration and physical condition. Conversely, a high standard deviation means that performance fluctuates considerably, allowing coaching staff to adjust training methods or competition strategies accordingly. This enables athletes to deliver more consistent performance.
The Standard Deviation Calculation Process and How to Apply It Accurately
Starting the Standard Deviation Calculation: Finding the Mean
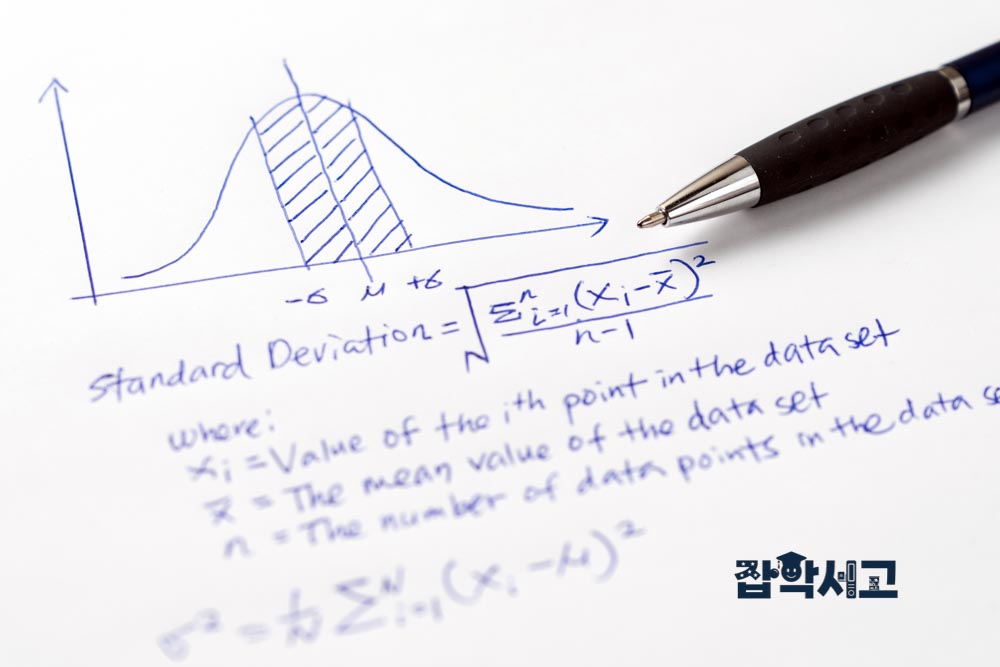
The first step in calculating standard deviation is finding the mean of the data. This reveals the central tendency of the entire dataset. The mean is calculated by adding all data values and dividing the total by the number of data points. This process provides an important reference point for subsequent calculations and is essential for understanding how the data is distributed around the mean.
For example, suppose five students received test scores of 70, 75, 80, 85, and 90; their mean is 80. This indicates that the students' scores are generally distributed around 80 points.
Calculating Deviations: Measuring How Far Each Data Point Is from the Mean
After finding the mean, you must calculate how far each data point is from it. This is called a deviation and is calculated by subtracting the mean from each data value. Calculating these deviations reveals how the data is distributed around the mean.
However, because these deviations can be negative, each deviation is squared to address this. Squaring converts negative values into positive values, allowing all deviations to be evaluated on the same scale. This is an important step in understanding data variability more clearly.
Calculating Variance: Finding the Mean of the Squared Deviations
Add all the squared deviations and divide the total by the number of data points. An important consideration in this process is that the divisor differs depending on whether the data represents a population or a sample. When calculating the standard deviation of an entire population, divide by the number of data points, but when calculating the standard deviation of a sample, divide by the number of data points minus 1. This adjustment accounts for the possibility that the sample may not perfectly represent the population.
For example, for a population, variance is calculated simply by dividing by the number of data points, while for sample data, it must be calculated by dividing by the sample size minus 1. This reflects the uncertainty that may arise when estimating population characteristics from a sample.
Obtaining the Final Standard Deviation: Taking the Square Root
After finding the mean of the squared deviations, take its square root to obtain the final standard deviation. The square root is taken to return the previously squared deviations to their original units. This makes data variability easier to understand intuitively and provides a clear understanding of how the actual data is distributed.
This process summarizes data variability in a single number, playing an important role in interpreting and analyzing data.
Considerations Regarding Whether the Data Follows a Normal Distribution
When applying standard deviation, you must consider whether the data follows a normal distribution. Because standard deviation fundamentally assumes a normal distribution, its interpretation may be distorted if the data does not follow one. In such cases, additional analysis or adjustments may be necessary. It is therefore important to understand the shape of the data distribution thoroughly before calculating standard deviation.
The Practical Meaning and Use of Standard Deviation
It is important to go beyond simply calculating standard deviation and apply the variability represented by its value in practice. For example, companies can use standard deviation to identify quality variations in production processes, while investors can assess asset risk. This enables more refined decision-making and strengthens data-driven strategies.
Ultimately, standard deviation is an important tool for data analysis, and understanding and using it correctly plays a key role in improving data-driven decision-making.
Strategies for Using Standard Deviation to Improve Operational Efficiency

Managing Risk by Identifying Variability in Advance
The first strategy for using standard deviation is to analyze data to identify and manage variability in advance. This can reduce unforeseen risks and establish a stable operating environment. For example, when managing a supply chain, using standard deviation to analyze variability in inventory levels allows supply instability to be recognized and prepared for in advance. This analysis helps avoid excessive inventory or shortages, reduce costs, and improve operational efficiency.
Improving Customer Satisfaction Through Quality Control
Standard deviation also plays an important role in quality control. Monitoring and minimizing variations in product or service quality can greatly improve customer satisfaction. Inconsistent quality can increase customer complaints, but managing quality variations in advance through standard deviation can prevent these problems. For example, analyzing standard deviation to ensure that product weight, size, and other characteristics do not vary too widely can help maintain consistent quality. This increases customer trust and contributes to improving a company's image.
Developing Tailored Strategies Through Data Segmentation
Standard deviation can be used to perform segmentation based on data. This helps develop tailored strategies by segmenting customers, products, markets, and other categories. Analyzing variability reveals which groups show greater differences, allowing suitable strategies to be applied to each segment. For example, customer groups with inconsistent purchasing patterns can be managed more effectively through tailored marketing or discount strategies. This maximizes marketing efficiency and allows resources to be allocated more efficiently.
Using Standard Deviation for Risk Management
Standard deviation is an essential tool in risk management. Analyzing data through standard deviation allows potential risks to be identified in advance and strategies to be developed in response. Because greater variability means higher risk, understanding it accurately is important. For example, in finance, the standard deviation of stocks or assets can be analyzed to assess investment risk. Assets with high standard deviations carry greater risk, but stable returns can be expected if appropriate measures are developed based on this information.
Providing Comprehensive Insights Through Integrated Analysis
It is advisable to combine standard deviation with other statistical measures for a more comprehensive analysis. Using standard deviation alongside measures such as the mean, median, and range provides a deeper understanding of the overall distribution and characteristics of the data. For example, the mean alone reveals the central tendency of the data, but analyzing standard deviation alongside it shows how widely the data is spread around the mean. This integrated analysis provides important information that a single measure may miss, offering deeper insights for data-driven decision-making.
Responding in Real Time Through Continuous Monitoring
Continuous monitoring using standard deviation is an important strategy for maximizing operational efficiency. Analyzing data and calculating standard deviation in real time allows rapid responses to changing conditions. For example, when customer behavior fluctuates in response to market changes, analyzing standard deviation based on real-time data allows companies to develop new strategies quickly. This is a key element of data-driven decision-making that develops a company's ability to respond swiftly to changing market conditions.
Standard deviation is an important tool for understanding data variability and characteristics, enabling more accurate data analysis and decision-making. This article covered the basic concept and practical importance of standard deviation, how to calculate it, and strategies for using it efficiently.
This knowledge contributes to strengthening data-driven decision-making across various fields and will help develop more effective strategies. We hope that accurately understanding and using standard deviation will help you improve your data analysis skills and maximize practical results.