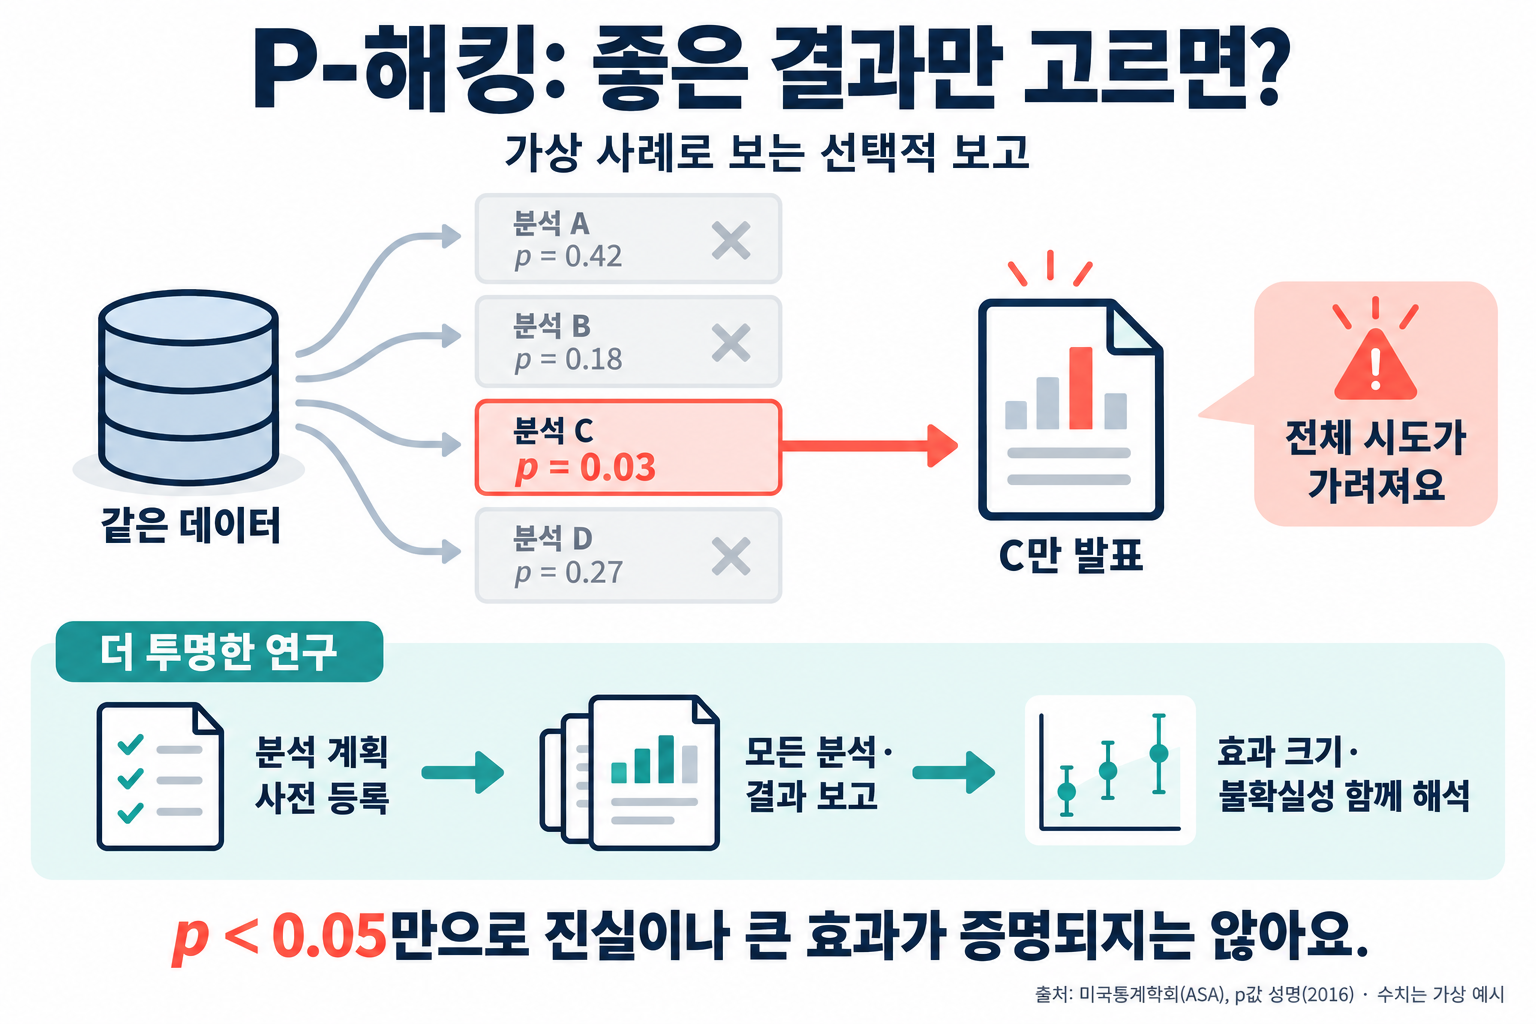
Have you ever seen a news story saying that eating chocolate every day helps you lose weight? In 2015 this finding was reported by media in several countries and became a big talking point. But not long afterwards, John Bohannon, the journalist who ran the study, made a confession. The study was an experiment deliberately set up to show how easily junk science spreads: he had measured 18 different things at once, including weight, cholesterol and sleep quality, and highlighted only the results that happened to differ by chance.
Analysing data this way and that until the desired result appears, producing “statistically significant” numbers, is called “P-hacking.” No data are falsified; only the analysis method is chosen, yet the result looks like a genuine discovery. That is why it is a trap researchers can easily fall into without even realising it.
In this article, we will look in turn at what the p-value, the starting point of P-hacking, actually means, the typical ways P-hacking happens, the replication crisis it left behind in science, and the methods used to prevent it.
Torture the Numbers and They Will Confess: How P-hacking Works and How to Counter It
What Are p-values and Significance Levels?

To understand P-hacking, you first need to know what a p-value is. Researchers usually set up a null hypothesis stating that “there is no effect,” and then ask how likely it is that the result they actually obtained could have arisen by chance alone.
- p-value: The probability of getting a result as extreme as, or more extreme than, the one observed, assuming there is no effect at all.
- Significance Level: The threshold for judging that a result is not due to chance; 0.05 (5%) is commonly used.
- False Positive: Wrongly concluding that there is an effect when in fact there is none, because the result crossed the threshold by chance.
The problem lies in the threshold being 5%. If you run 20 tests where there is no effect at all, on average 1 of them will produce a “significant” result by chance. If you run 20 independent tests, the probability of crossing the threshold at least once reaches about 64%. Try many times and show only the successes, and even chance can look like a discovery.
How Does P-hacking Happen?

The term P-hacking was first used in a 2014 paper by the American psychologists Uri Simonsohn, Leif Nelson and Joseph Simmons. Earlier, in 2011, they had exposed the problem by making the absurd conclusion that people who listened to the Beatles song “When I’m Sixty-Four” actually became younger appear statistically “significant.”
(1) Measuring many outcomes and picking only the good ones
As in the chocolate study, researchers measure a large number of outcomes and report only those that crossed the threshold.
(2) Stopping once the desired result appears
Data are collected bit by bit and tested each time, and collection stops the moment the p-value drops below 0.05.
(3) Splitting groups and removing outliers
If there is no effect overall, the data are split by sex or age group, and data that get in the way of the result are removed on the grounds that they are “outliers.”
(4) Rewriting the hypothesis after seeing the results
A pattern found in the data is described as if it had been predicted from the start. A hypothesis obtained through exploration should be checked again with new data, but if this step is skipped, a chance pattern becomes the conclusion as it is. This is called HARKing.
The Numbers Behind the Replication Crisis

Because results obtained through P-hacking are products of chance, they often fail to appear again when other researchers run the same experiment. This has grown into a problem of trust in science as a whole.
Effects That Vanished When Tested Again
In 2015, the Reproducibility Project, involving more than 270 researchers, repeated 100 studies published in prominent psychology journals. Most of the original studies had reported significant results, but only about 36% reached the same conclusion when repeated. This news spread the term “Replication Crisis” widely.
Failures Buried in the Drawer
Journals favour new, significant results over findings that show no effect. As a result, failed studies go unpublished and stay in the drawer; this is called Publication Bias or the file drawer problem. Such an environment tempts researchers to push their p-values below 0.05.
How to Prevent P-hacking

In 2016, the American Statistical Association (ASA) issued an official statement on p-values, stressing that the value of a study should not be judged by a p-value alone. Since then, several measures have come into use together.
(1) Registering in advance
Before collecting data, researchers first register their hypotheses and analysis methods in a public repository. The Registered Report format, in which a journal promises to publish a study regardless of its results, is also spreading.
(2) Making the threshold stricter for more tests
If several hypotheses have been tested, the threshold is raised by dividing the significance level by the number of tests, as in the Bonferroni Correction.
(3) Sharing data and analysis procedures
When raw data and analysis code are published together, other researchers can check the results directly and recalculate them.
As the saying attributed to the economist Ronald Coase goes, if you torture the data long enough, you can make it confess to anything. Numbers do not lie, but the person choosing the numbers can create any story they want. That is why good research starts not with surprising results but with transparently showing the process that led to them.
Asking once more, when faced with a research finding, how many attempts it took to get that number is the first step toward reading statistics with a clear eye.