When you think of a weekend trip, a beach two or three hours away by car or a nearby neighboring country comes to mind before a country more than twelve hours away by plane. In fact, in almost any country’s outbound travel statistics, nearby countries always rank near the top. The concept that explains why fewer people visit a destination the farther away it is, is ‘Distance Decay’.
Simply put, distance decay means ‘the phenomenon in which the movement of people, goods and information between two places declines as the distance between them grows’. The idea comes from geography and is closely linked to the First Law of Geography, which the American geographer Waldo Tobler summed up in 1970 as “everything is related to everything else, but near things are more related than distant things.” In tourism studies, Greer and Wall (1979) are credited as the first researchers to examine how distance affects tourism demand.
In this article, we will look in turn at the basic principle of distance decay, the decay curve and key terms shown in a diagram, what it looks like in international tourism statistics, and finally its uses and limits.
Fewer footsteps the farther you go: distance decay
1. The basic principle of distance decay

When people decide whether to go somewhere, distance always works as a cost. The farther they go, the more money, time and effort it takes, so if all else is equal, nearer places are chosen more often.
(1) Friction of distance
Geographers call the force by which distance holds back movement the friction of distance (Friction of Distance). Just as friction on the floor makes a heavy box hard to push, distance gradually reduces how much people move.
(2) Three costs that grow together
As distance increases, monetary costs such as transport and accommodation, the time cost of travel, and psychological costs such as the fatigue of long-haul flights or the burden of an unfamiliar environment all grow together. Tourists choose a destination by weighing these costs against the enjoyment they expect from the trip.
(3) Map distance and perceived distance
Kilometers on a map are not the only kind of distance. Depending on whether there are direct flights, whether a visa is required, and how different the language and culture are, the same distance can feel closer or farther. That is why researchers sometimes break distance down into time distance, cost distance and cultural distance.
2. The decay curve and key terms in a diagram

Distance decay is usually shown as a curve with distance on the horizontal axis and the number of visitors or the volume of movement on the vertical axis. It is high near the origin and falls as distance grows, quickly at first and then more gently.
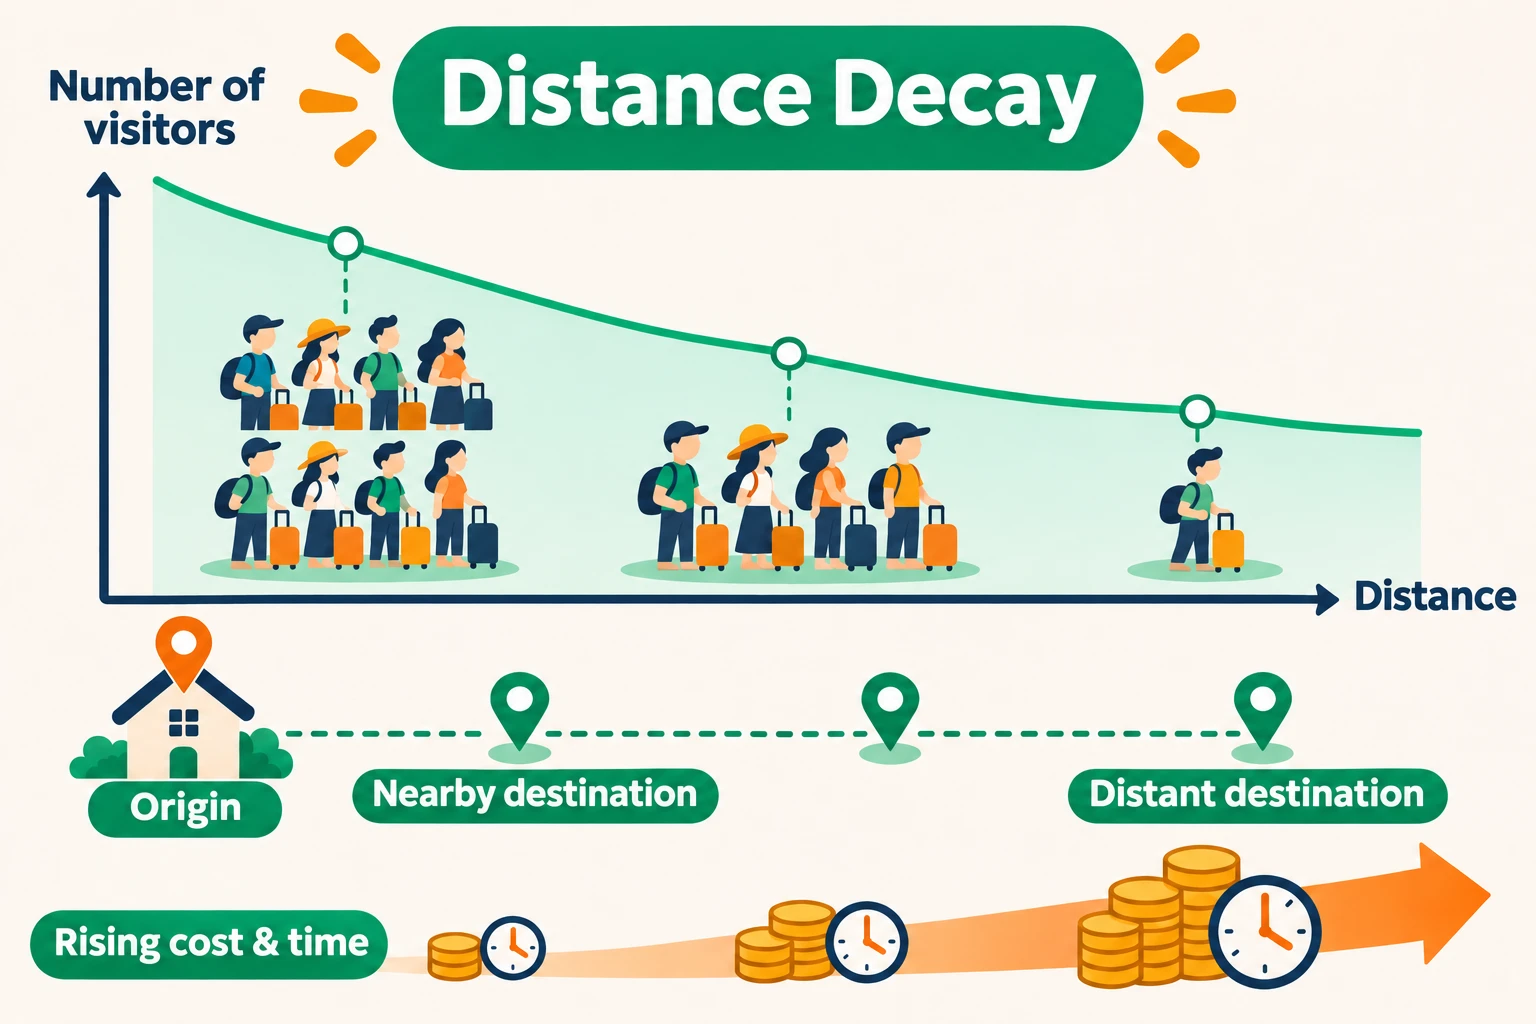
- Distance decay: The phenomenon in which interaction between two places declines as the distance between them grows.
- Friction of distance: An expression that compares the force by which distance holds back movement and exchange to friction.
- Gravity model: A model holding that exchange increases the larger two regions are and decreases the farther apart they are, built as an analogy to Newton’s law of universal gravitation.
- Time-space convergence: The phenomenon in which faster transport and communication reduce the time it takes to travel the same distance.
(1) Power curve
This approach assumes that movement falls in inverse proportion to a power of distance. The gravity model is the typical example, and the curve drops especially steeply in the section close to the origin.
(2) Exponential curve
This approach assumes that each time distance increases by a fixed amount, movement falls by the same proportion. In tourism research, Bull offered the classic explanation in 1991 that tourism demand decreases exponentially with distance.
(3) Zone of indifference and cutoff distance
Some models set a zone of indifference, assuming that within a very short range differences in distance hardly affect choices. Conversely, some set a cutoff distance beyond which movement is assumed to stop almost entirely.
3. Distance decay in international tourism statistics

Distance decay also appears clearly in real international tourism statistics. The Hong Kong tourism scholar Bob McKercher and his colleagues have confirmed it several times using data from the World Tourism Organization (UNWTO).
(1) Trips to neighboring countries
In the study by McKercher, Chan and Lam (2008), which analyzed 2002 data, travel between countries sharing a land border made up 56% of the total, and trips to destinations within 2,000km of the origin made up 93%. Demand was found to fall by about 50% for every additional 1,000km.
(2) An analysis of 92 markets in 2016
In 2019, McKercher and Mak used 2016 data to examine 92 source markets and more than 4,700 origin–destination pairs. Land neighbors accounted for 53.3% of all departures, destinations within 2,000km received about 79%, and destinations more than 5,000km away usually received 3% or less.
(3) A distance band where tourism is empty
McKercher’s team called a distance band where little tourism activity occurs an Effective Tourism Exclusion Zone. In many markets, visitor numbers dropped sharply in the 4,000–4,999km range, and for island nations the peak of demand was pushed out to 2,000–2,999km.
4. Uses and limits of distance decay

Distance decay is a starting point for deciding whom a destination should welcome as its main visitors. However, distance alone cannot explain every trip.
(1) Choosing markets and forecasting demand
Destinations treat nearby markets as core customers and target distant markets separately, for example with long-stay products, dividing their marketing in this way. The gravity model is also used to forecast tourism demand and demand for air routes.
(2) The lowering wall of distance
As low-cost airlines and direct routes increase, perceived distance becomes shorter. In McKercher and Mak’s study as well, the share of destinations within 1,000km fell from about 80% in 2002 to below 65% in 2016, while the share of medium-distance trips beyond that grew.
(3) When distance itself becomes the attraction
In some cases, such as honeymoons or once-in-a-lifetime trips, the very fact of going far away becomes the value. In regions like Europe, where small countries sit side by side, the curve continues more gently, so its shape differs from region to region.
Distance decay is ultimately a concept that shows how people choose destinations by weighing cost against enjoyment. If you spread out a map and point to the places you have visited, you may find that they are clustered closer than you thought. The simple idea that the farther a place is, the less we go there, is the first step to understanding distance decay.