Probability distributions are a core concept in statistics and data science and an essential tool for analyzing and understanding the characteristics of various phenomena and data. With probability distributions, we can not only identify patterns in data but also make predictions and manage uncertainty based on them.
This article systematically analyzes probability distributions, from their basic concepts to advanced applications. It first covers the definition and historical background of probability distributions, then takes an in-depth look at the types of probability distributions and the characteristics of each. It also introduces their mathematical expressions and calculation methods, and finally uses examples to explain how probability distributions are applied in practice and what effects they have.
Basic Concepts and Historical Background of Probability Distributions

Definition and Types of Probability Distributions
A probability distribution is a mathematical expression of how likely events are to occur. It shows the probability that data falls on a particular value or within a particular range, and it is used to analyze the values of a random variable. Probability distributions fall into two broad types: continuous probability distributions and discrete probability distributions. Continuous probability distributions deal with variables that can take any real value within a given range, the normal distribution being a typical example. Discrete probability distributions, on the other hand, deal with variables whose values can be counted one by one, such as 0, 1, and 2, with the Bernoulli distribution and the Poisson distribution as examples. These distributions play an important role in many fields, including data analysis, machine learning, and financial engineering.
Historical Background of Probability Distributions
The concept of probability distributions emerged in the 18th century as mathematicians developed probability theory. Among them, Pierre-Simon Laplace established the foundations of probability theory and, building on it, defined a variety of probability distributions. Throughout the 19th and 20th centuries, many mathematicians continued to study probability distributions, and in the process important probability distribution models such as the normal distribution, the Poisson distribution, and the Bernoulli distribution were developed. This research still forms the foundation of probability theory today.
Probability Density Function (PDF) and Cumulative Distribution Function (CDF)
Two important concepts for understanding probability distributions are the probability density function (PDF) and the cumulative distribution function (CDF). The PDF represents how much probability is concentrated near a particular value, that is, the probability density, while the CDF represents the accumulated probability up to and including a particular value. The PDF is mainly used for continuous random variables and is useful for visualizing how the probability density changes from value to value. The CDF, by contrast, lets us interpret data by accumulating probability over a range of values. Both functions are important tools for analyzing data and understanding its characteristics.
Expected Value and Variance
Other important concepts in probability distributions are expected value and variance. The expected value represents the mean of a random variable and is useful for identifying the value around which the data is distributed. Variance represents the spread of the data, that is, how far the data is dispersed from the mean. The larger the variance, the greater the variability of the data, and this variability can also be expressed as the standard deviation. Expected value and variance are important indicators of the central tendency and variability of data.
Probability Distributions in Modern Data Science
In modern data science, probability distributions have become an essential tool. They are used in many fields, such as big data analysis, machine learning modeling, and financial risk management, enabling more sophisticated analysis and prediction of the characteristics of data. For example, machine learning uses probability distributions to improve the predictive accuracy of models, and finance uses them for risk management and pricing models. This makes it possible to offer better answers to complex data problems.
Probability Distributions and Hypothesis Testing
Probability distributions also play an important role in statistical hypothesis testing. Hypothesis testing is the process of determining whether given data follows a particular probability distribution, and it allows us to evaluate the reliability of data. Through hypothesis testing, researchers can determine whether the data they have collected is statistically significant and draw reliable conclusions from the results. It is an important tool not only in scientific research but also in business decision-making.
Types and Characteristics of Probability Distributions
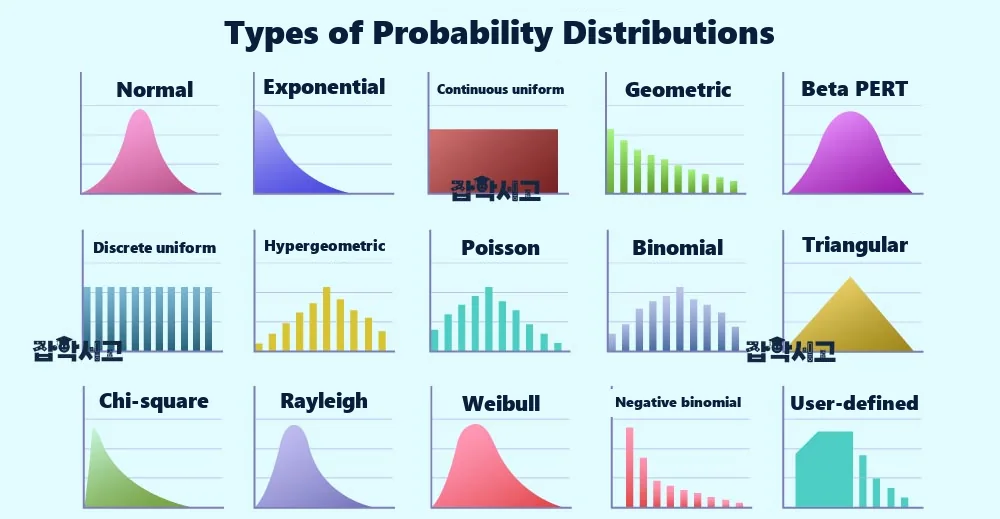
Types of Probability Distributions
Probability distributions are broadly divided into discrete distributions and continuous distributions. Discrete distributions deal with cases where only specific values are possible, while continuous distributions deal with cases where values can vary continuously. Each of these distributions has its own characteristics and uses, and they play an important role in data analysis and prediction.
Discrete Distributions
Discrete distributions are used when a random variable can take only values separated by fixed intervals. Typical discrete distributions include the Bernoulli distribution, the binomial distribution, and the Poisson distribution.
The Bernoulli distribution is the most basic form of discrete distribution and applies when there are only two possible outcomes. For example, the Bernoulli distribution is used to calculate the probability of getting heads or tails when tossing a coin. This distribution has two outcomes, success and failure, with the probability of success written as p and the probability of failure as 1-p. This simple structure serves as the basis for more complex distributions.
The binomial distribution is an extension of the Bernoulli distribution and is used to analyze the probability that a particular event occurs over several independent trials. For example, the binomial distribution is suitable for calculating the probability of rolling a particular number when a die is rolled 10 times. The binomial distribution is defined by the number of trials n and the probability of success p, and it is useful for analyzing the likelihood of outcomes in repeated experiments.
The Poisson distribution is used to model the number of times an event occurs within a given time or space. This distribution assumes that events are independent of one another and is mainly used to analyze rare events. For example, the Poisson distribution is applied when analyzing the number of customers visiting a store or the number of traffic accidents occurring during a certain period. The Poisson distribution is defined by the average number of occurrences λ and is well suited to predicting how often events occur.
Continuous Distributions
Continuous distributions are used when a random variable can take continuous values. Typical continuous distributions include the normal distribution, the uniform distribution, and the exponential distribution.
The normal distribution is the most representative continuous distribution and applies when data is distributed symmetrically around the mean. The normal distribution is frequently observed in natural phenomena and human activities, and much real-world data follows it. For example, people's heights and test scores generally follow a normal distribution. The normal distribution is defined by its mean and standard deviation, and by the central limit theorem, the larger the sample size, the closer most distributions come to the normal distribution. This makes it a very important tool in data analysis.
The uniform distribution is used when every value within a certain interval occurs with equal probability. It is often used for random number generation and sampling, and it is suitable for modeling situations that show an even distribution. For example, the uniform distribution is used when generating random numbers or drawing values at random.
The exponential distribution is used to analyze the intervals between occurrences of a particular event. For example, it is suitable for modeling how long one waits until a customer arrives at a store. The exponential distribution is mainly used in queueing theory and is effective for predicting the time intervals between events. Based on the expected value of the random variable, the exponential distribution can be used to analyze how frequently events occur.
Real-Life Applications of Probability Distributions
Probability distributions are not merely mathematical concepts; they are put to practical use in many fields. In big data analysis, machine learning, financial engineering, medicine, and more, probability distributions are essential tools for analyzing and predicting the characteristics of data. For example, financial markets use the normal distribution to analyze the volatility of asset prices, and the medical field can use the Poisson distribution to predict disease incidence. Probability distributions also play an important role in statistical hypothesis testing, where they are used to determine whether given data follows a particular distribution.
Mathematical Expressions and Calculation Methods of Probability Distributions

Mathematical Expressions of Probability Distributions
Probability distributions can be expressed mathematically in a variety of ways, which allows the characteristics of data to be analyzed clearly. Probability is defined differently for discrete and continuous random variables, and each distribution has its own mathematical expression. Discrete distributions such as the binomial and Poisson distributions use a probability mass function (PMF) to calculate the probability of each outcome, while the normal distribution, a continuous distribution, uses a probability density function (PDF) to define probability density.
Probability Mass Function (PMF) of Discrete Probability Distributions
The binomial distribution is used to calculate the probability of a certain number of successes over multiple trials of an experiment whose outcome is either success or failure. The probability mass function (PMF) of the binomial distribution is defined as follows.
- P(X=k) = C(n,k) * p^k * (1-p)^(n-k)
Here, C(n, k) denotes the number of combinations, n is the number of trials, k is the number of successes, and p is the probability of success. This formula is a way to mathematically calculate the probability of a particular outcome under given conditions.
The Poisson distribution is well suited to predicting how frequently events occur within a given time or space. Its probability mass function (PMF) is expressed as follows.
- P(X=k) = (λ^k * e^(-λ)) / k!
Here, λ is the average number of occurrences and k is the number of events that occur. This formula lets us calculate the probability that an event occurs a certain number of times during a certain period. The Poisson distribution assumes that occurrences are independent of one another and is very useful for analyzing the frequency of rare events.
Probability Density Function (PDF) of Continuous Probability Distributions
For continuous distributions, the probability density of each value is expressed by a probability density function (PDF). The normal distribution, a typical continuous distribution, is symmetric around its mean, and its probability density function is defined as follows.
- f(x) = (1 / (σ * sqrt(2π))) * exp(-0.5 * ((x-μ)/σ)^2)
Here, μ is the mean and σ is the standard deviation. This formula is used to calculate the probability density at a particular value and reflects the central tendency and variability of the normal distribution. The normal distribution appears frequently in many natural phenomena and social data and plays an important role in data analysis.
Cumulative Distribution Function (CDF)
The cumulative distribution function (CDF) represents the accumulated probability up to and including a particular value. It is useful for calculating the probability that a random variable falls within a particular range, and it is especially often used to calculate the probability that a value lies within a certain interval of a normal distribution. The CDF can be obtained by integrating the probability density function (PDF).
Expected Value and Variance
Other important characteristics of a probability distribution are its expected value and variance. The expected value (E[X]) represents the mean of a random variable and is used to locate the center of a probability distribution. The expected value of a discrete random variable is calculated as follows.
- E(X) = Σ [x * P(x)]
For a continuous random variable, the expected value is calculated in the form of an integral, as follows.
- E(X) = ∫ x * f(x) dx
Variance (Var[X]) represents how widely a random variable is spread out from its mean. Variance is an important measure of the variability of data and is calculated as follows.
- Var(X) = E[(X - E(X))^2]
This formula is useful for analyzing how far a random variable deviates from its mean and serves as a standard for mathematically evaluating the variability of data.
Tools for Calculating Probability Distributions
Mathematical calculations involving probability distributions can be carried out with a variety of software and programming languages. R, Python, MATLAB, and others provide functions and tools suited to each probability distribution, making complex probability calculations easy to handle. In particular, Python's SciPy and NumPy libraries and R's stats package are useful tools for performing probability distribution calculations simply. Using these tools makes data analysis and predictive modeling more effective.
Real-World Applications of Probability Distributions and Analysis of Their Effects

Probability Distributions in Finance
Probability distributions play an important role in risk management and return analysis in finance. They are used to predict the volatility of stock prices in the stock market and, based on that, to evaluate the risk of a portfolio. The normal distribution is often used to analyze the distribution of stock returns, which makes it possible to calculate risk measures such as VaR (Value at Risk). VaR is a measure that predicts the maximum loss that could occur over a certain period, allowing investment risk to be assessed and prepared for in advance.
Applications of Probability Distributions in the Insurance Industry
In the insurance industry, probability distributions are essential for setting premiums based on the probability that customers will have accidents. The Poisson distribution in particular is useful for analyzing the number of accidents over a certain period, which makes it possible to calculate accident risk and set appropriate premiums. For example, auto insurance determines premiums by analyzing the number of accidents that will occur over a certain period. Life insurance, meanwhile, analyzes the probability distribution of survival time to calculate life expectancy and sets insurance amounts on that basis.
Quality Control and Probability Distributions in Manufacturing
Manufacturing analyzes the probability of product defects and uses it for quality control. The Poisson distribution is well suited to analyzing the number of defects in products, making it possible to identify patterns in how defects arise during production. For example, by analyzing the probability that more than a certain number of defects will occur among mass-produced parts, manufacturers can strengthen quality control and improve production processes. Through this kind of analysis, manufacturers can minimize defect rates and increase production efficiency.
Probability Distributions in Medicine
Probability distributions also play an important role in medicine. They are used to analyze patient survival rates, the probability of disease, and more in order to develop treatment strategies. For example, when analyzing the effect of a particular drug, the normal distribution can be used to analyze clinical trial data and evaluate the statistical significance of the results. This helps medical professionals decide on the most suitable treatment for patients and develop new treatments. In addition, the Poisson distribution is used to predict the frequency of disease, contributing to the planning of preventive measures.
Applications of Probability Distributions in Marketing
In marketing, probability distributions are used to predict customer behavior and develop effective marketing strategies. Marketing campaigns can be optimized by analyzing customers' purchasing patterns, and the binomial distribution can be used to predict the probability that a customer will buy a particular product within a certain period. For example, by analyzing the behavior of customers who buy regularly, companies can strengthen targeted marketing and thereby increase sales. Probability distributions are also used to evaluate customer lifetime value, helping to improve a company's long-term profitability.
Applications of Probability Distributions in Engineering
In engineering, probability distributions are widely used in system reliability analysis, network traffic analysis, queueing theory, and more. For example, the exponential distribution is used to analyze the intervals between system failures, making it possible to evaluate system reliability and plan maintenance. In networking, data traffic is analyzed based on queueing theory to enable efficient resource management. Such analysis increases system stability and maximizes operational efficiency.
The Effects and Importance of Probability Distributions
Probability distributions make data analysis and prediction possible across many industries, allowing uncertainty to be managed and accurate decisions to be made. In finance, insurance, manufacturing, medicine, marketing, engineering, and other fields, probability distributions have become an essential tool for understanding the characteristics of data and predicting the future. Using probability distributions appropriately plays an important role in minimizing risk and maximizing efficiency.
Probability distributions are an essential tool used in many fields, playing an important role in analyzing the characteristics of data and improving the accuracy of predictions. This article has comprehensively covered the basic concepts and historical background of probability distributions, the types and characteristics of distributions, their mathematical expressions and calculation methods, and real-world applications and their effects.
A deep understanding of probability distributions is an important factor in improving the accuracy of data analysis and prediction. We look forward to further advances in many fields through continued research on and use of probability distributions.