
Imagine comparing the test scores of two classes. If the averages are the same, the spread of scores is the same, and even the number describing the relationship between study time and scores is identical, can we say the two classes are practically the same? Most people would say yes. But when you plot these numbers on a graph, completely different shapes can appear. What showed this fact with just four sets of data is ‘Anscombe’s Quartet.’
Put simply, Anscombe’s Quartet means ‘four datasets whose summary statistics, such as the mean, variance, correlation coefficient, and regression line, are almost exactly the same, but which look completely different when graphed.’ A quartet is a musical term for a piece played by four performers together, and the name was given because the four datasets work as one set.
In this piece, we will look in turn at the background of how Anscombe’s Quartet was made, the trap each of the four graphs reveals, the dinosaur-shaped data that followed, and how to read data properly.
How to See the Shape Hidden Behind the Numbers
What Is Anscombe’s Quartet?

This dataset was first introduced by British-born statistician Francis Anscombe in his paper ‘Graphs in Statistical Analysis,’ published in 1973 in the journal The American Statistician. At the time, statisticians tended to believe that ‘calculations are exact, while graphs are just for a rough look,’ and Anscombe wanted to overturn this idea.
(1) Identical Summary Statistics
Each of the four sets consists of 11 points, and the following values are nearly the same.
- Mean of x: Exactly 9 for all four sets.
- Variance of x: Exactly 11 for all four sets.
- Mean of y: The same, 7.50, to two decimal places.
- Correlation Coefficient: The same, 0.816, to three decimal places.
- Regression Line: The same for all, y = 3.00 + 0.500x.
(2) What Anscombe Wanted to Say
Looking only at the numbers, the four datasets seem like twins. But Anscombe set out to show that if you start calculating without drawing a graph, you miss the true nature of the data.
The Traps the Four Graphs Reveal
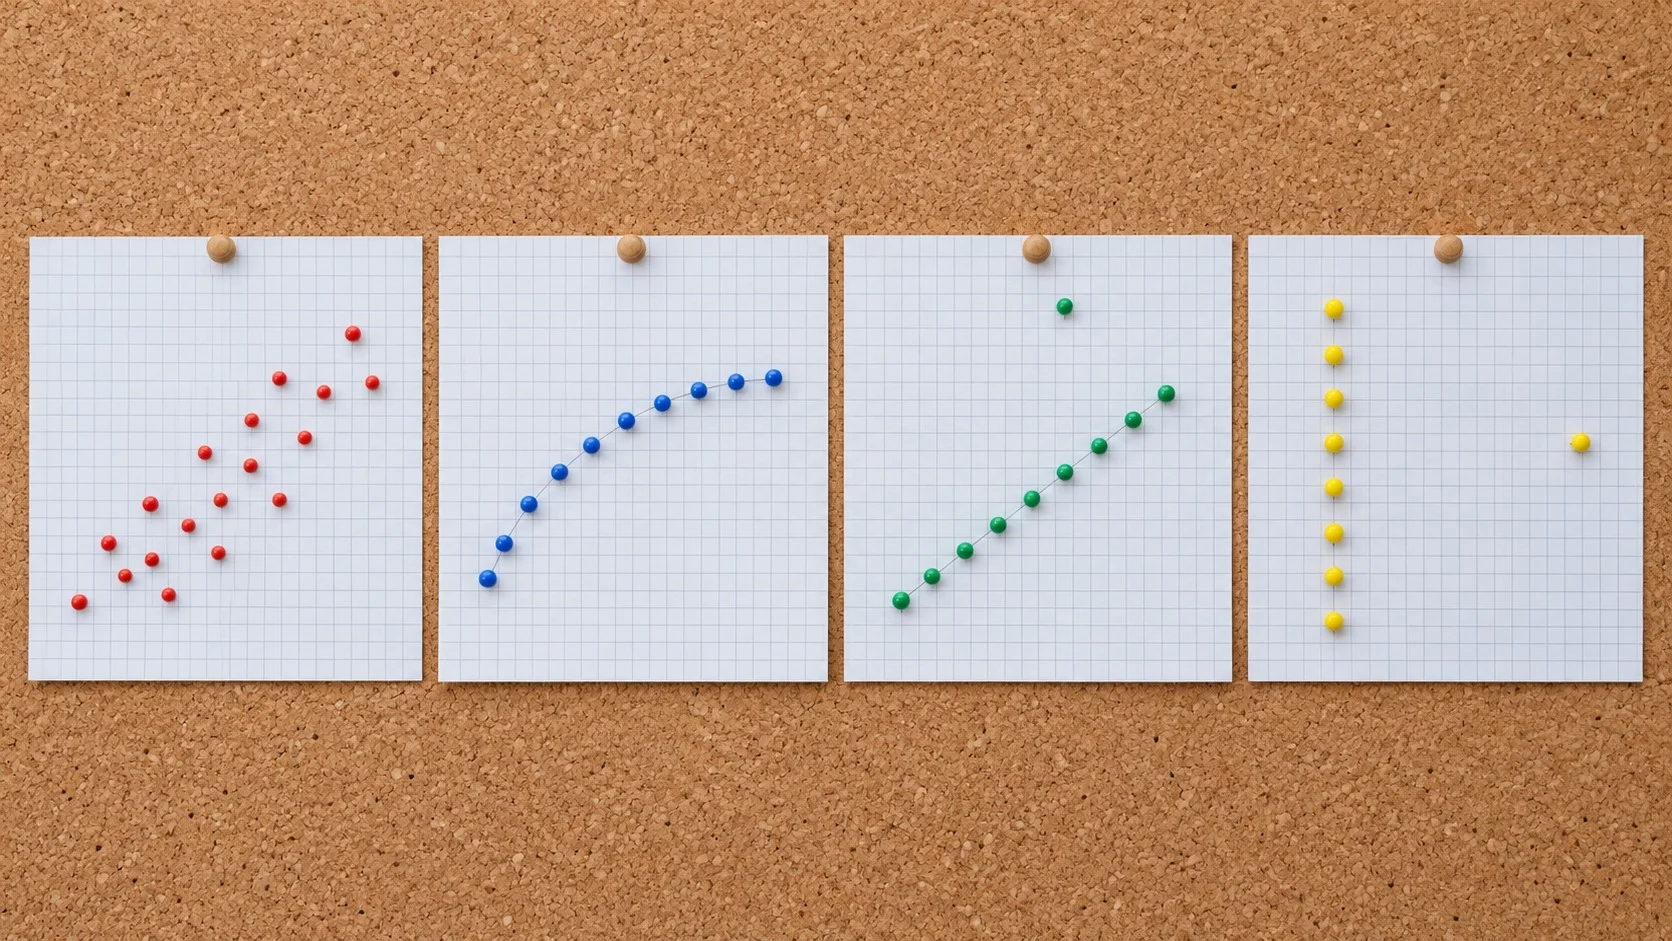
When the four sets are drawn as scatter plots, the differences the numbers had been hiding become clear at a glance.
(1) The First Set
The points are scattered diagonally toward the upper right. It looks like a linear relationship mixed with a little error, and it is the only case where the summary statistics describe the data relatively well.
(2) The Second Set
The points trace a smooth curve. There is a clear relationship between the two variables, but because it is not a straight line, the correlation coefficient and regression line, which assume a straight line, fail to capture this relationship properly.
(3) The Third Set
Ten points lie on an almost perfectly straight line, but a single point jumps far above it. This one outlier pulls the regression line toward it and lowers a correlation coefficient that would have been close to 1 down to 0.816.
(4) The Fourth Set
Ten points are all gathered on a vertical line at x = 8, and a single point sits alone at x = 19. Even though the other points say nothing about a relationship, this one isolated point creates a high correlation coefficient.
An Experiment That Led to a Dinosaur

How Anscombe created these numbers is not known. Later, researchers set out to find ways of deliberately creating datasets with the same summary statistics but different shapes.
[Case 1] The Datasaurus
In 2016, data visualization researcher Alberto Cairo created a dataset whose points draw a picture of a dinosaur and called it the ‘Datasaurus.’ It was a witty warning that a dinosaur might be hiding behind ordinary summary statistics.
[Case 2] The Datasaurus Dozen
In 2017, Justin Matejka and George Fitzmaurice of Autodesk Research built on this dinosaur data to present a method that moves the points little by little while keeping the summary statistics the same to two decimal places. The result was the ‘Datasaurus Dozen,’ 13 different pictures, including a dinosaur, a star, concentric circles, and stripes, that all share the same statistics.
How to Read Data Properly

Anscombe’s Quartet still often appears in the first class of statistics and data analysis courses, and it was also included in Edward Tufte’s book The Visual Display of Quantitative Information. The lessons this example leaves are as follows.
(1) Draw Before You Calculate
Before starting an analysis, check the shape of the data first with a scatter plot or histogram. Whether the relationship is curved, whether the data are bunched to one side, or whether any points stand apart from the cluster can only be seen by looking at a picture.
(2) Examine Stray Points Separately
Outliers and isolated points can shake the results greatly even when there are only a few of them. You should determine whether such a point is an input error or a genuinely special case before deciding on an analysis method.
(3) Don’t Draw Conclusions from a Single Number
A high correlation coefficient only means that the points lie close to a straight line; it does not tell you the shape of the relationship or the reason for it.
Anscombe’s Quartet shows that summary statistics are merely a shadow that compresses the data. Just as many different objects can cast the same shadow, completely different shapes can hide behind the same numbers.
Before trusting the numbers, plot the data they came from yourself. That is the first step of statistical thinking toward reading data correctly.