
Imagine two research papers. They have different titles and different authors, and neither has ever cited the other. Yet when you lay their reference lists side by side, the same books and the same papers show up again and again. If two studies were built on the same reading, they are probably working on similar problems. Measuring how close documents are by the overlap of their references is exactly what ‘bibliographic coupling’ does.
In simple terms, bibliographic coupling means ‘treating two documents as linked when they both cite the same third document, and judging them closer the more such documents they share.’ It was first proposed in 1963 by M. M. Kessler of the Massachusetts Institute of Technology (MIT) in the United States. It is regarded as one of the earliest methods for calculating similarity between documents from citation relationships.
This article looks at how bibliographic coupling came about, how coupling strength is counted, how it differs from co-citation analysis, and where it is used today.
Shared References Make Neighbors
How did bibliographic coupling begin?

The early 1960s were a time when the number of scientific papers was growing fast. It was becoming impossible for researchers to read everything in their own field, and a new way to pick out and group related papers was needed.
Titles and abstracts alone missed many connections. Two papers using completely different wording might in fact rest on the same experimental results. The idea of comparing not the surface of a text but the evidence it leans on grew out of this problem.
(1) Citations instead of subject terms
Until then, documents were grouped mainly by subject headings and classification codes assigned by people. But the same concept often goes by different names in different fields, so these labels easily diverged. Kessler argued that the references an author chooses personally are among the best clues to what a text is about.
(2) The 1963 proposal
Kessler set out the concept in a paper published in an American documentation journal and ran experiments on a set of physics papers. He wanted to show that grouping papers that share references really does produce clusters with similar topics.
(3) Meeting the citation index
Around the same time, Eugene Garfield created the Science Citation Index, which made it possible to handle citation data in bulk. Garfield also adopted the idea of bibliographic coupling and used it in his own work.
How coupling strength is counted
The calculation is very simple. Place the reference lists of two documents side by side and count the items they have in common. This number is called the ‘coupling strength.’
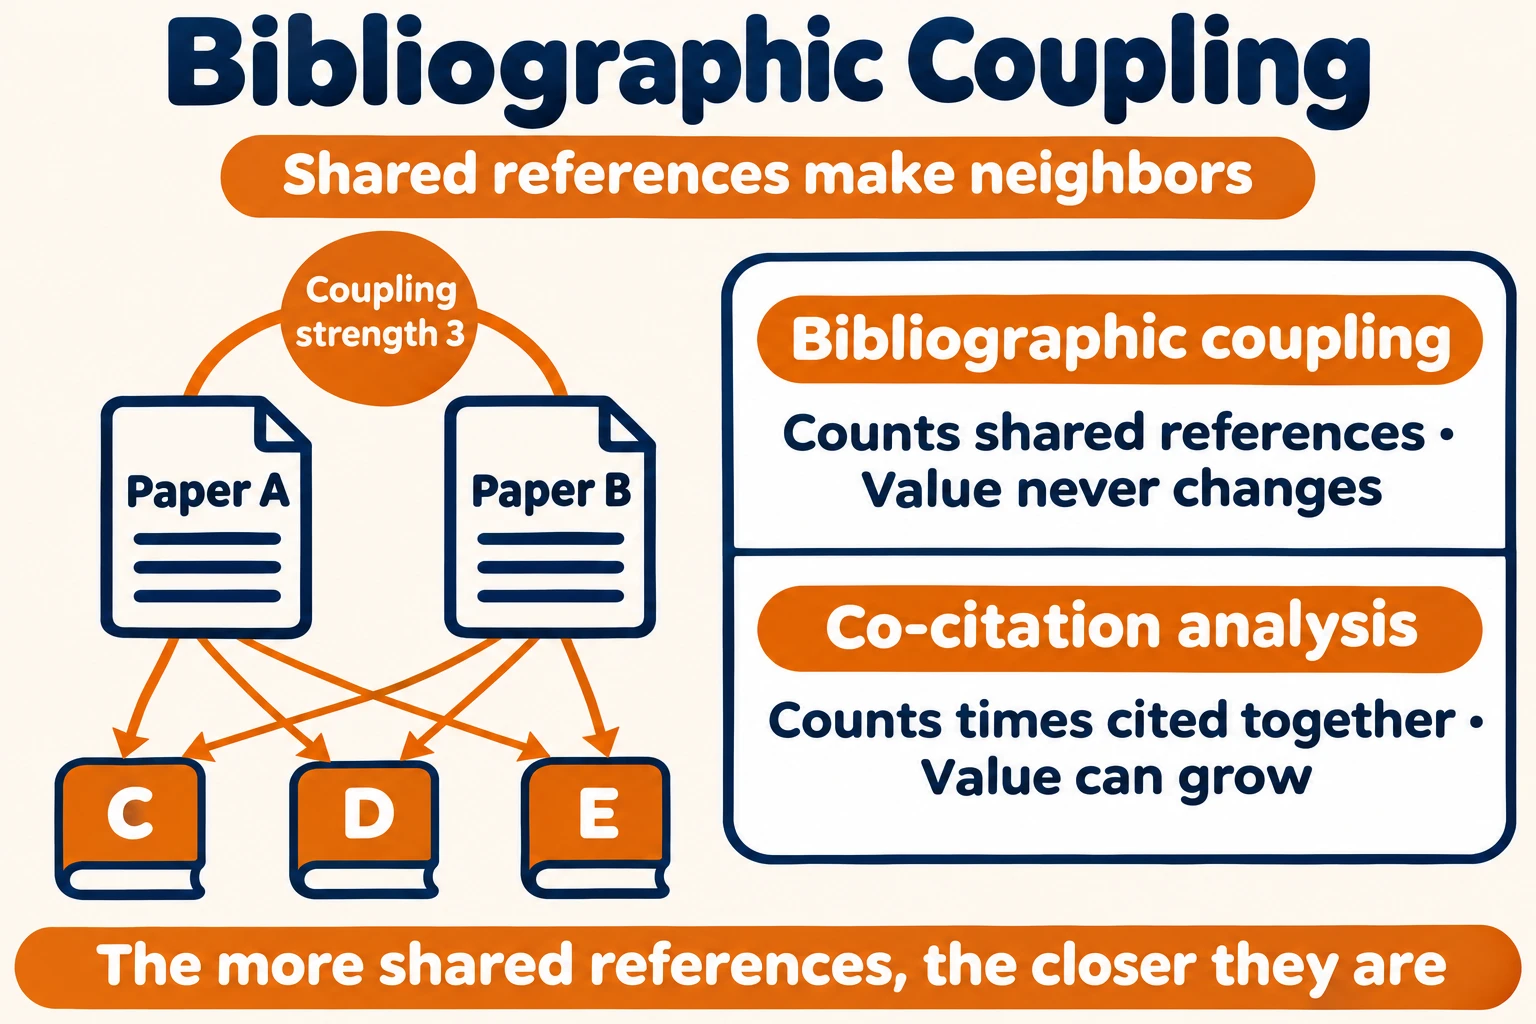
- Coupling Strength: The number of documents that two documents cite in common. If A and B both cite C, D and E, the strength is 3, and the higher the value, the more likely the two documents are close in topic.
- Unit of Coupling: Each individual shared reference that links two documents, a term used by Kessler. If there is none, the two documents are regarded as not coupled.
- Normalization: The longer a paper’s reference list, the more likely overlaps are to happen by chance, so real analyses sometimes adjust the value to account for list length.
The idea can be extended beyond single papers to authors. If you gather all the references from everything two researchers have written and count the overlap, you can glimpse who shares similar intellectual roots. In 2008, Dangzhi Zhao and Andreas Strotmann formalized this as author bibliographic coupling analysis. They also pointed out that because an author’s references keep growing as long as they keep writing, coupling strength at the author level can change over time.
How is it different from co-citation analysis?
A method often mentioned alongside bibliographic coupling is co-citation analysis. Both measure similarity through citations, but they look in opposite directions.
(1) Looking back or looking forward
Bibliographic coupling looks at the documents two papers ‘cite,’ in other words toward the past. Co-citation analysis, proposed by Henry Small in 1973, looks instead at later documents that ‘cite both’ papers together. One counts outgoing arrows, the other counts incoming arrows.
(2) A fixed value and a growing value
A paper’s references are fixed the moment it is published. So the bibliographic coupling strength between two papers does not change over time. Co-citation can grow every time a new paper appears, so it shifts as the academic community’s judgment accumulates.
(3) Strong with brand-new papers
This difference can be an advantage. A paper that has just been published and that nobody has cited yet cannot be analyzed by co-citation. But its references exist from day one, so bibliographic coupling can find its neighbors right away. That is also why some, such as Robert Amsler in 1972, proposed combining the two methods.
Where is bibliographic coupling used today?

Though the method is more than half a century old, it is still used in many places. The flood of digital citation data has, if anything, widened its range of uses.
(1) Recommending related papers
Academic search services often show papers that share many references with a given paper as ‘related papers.’ By following them, researchers can find earlier studies they had missed.
(2) Mapping research landscapes
In scientometrics, large numbers of papers are linked by coupling strength to draw clusters of research topics like a map. This is especially useful for grasping trends in fields with many recent papers.
(3) Its limits are clear
Citing the same documents does not guarantee saying the same thing. Documents cited across every field, such as a widely used statistics textbook, can tie together papers on completely different topics. So rather than trusting the results as they are, it is better to look at them alongside other indicators.
The simple idea that texts which passed through the same bookshelf are likely to be neighbors is the first step to understanding bibliographic coupling.