Have you ever arrived at a bus stop, looked at the display board, and felt that you always seem to wait longer than you should? The timetable says a bus comes every 10 minutes, yet it often feels as if you stood there much longer, and that feeling is not just bad luck or imagination. In statistics, this phenomenon is called the ‘inspection paradox’.
Simply put, the inspection paradox means ‘the phenomenon in which a randomly chosen moment or person is more likely to land in something long or large, so the observed average looks bigger than the true average.’ The name comes from the idea that someone who drops in at an arbitrary time to ‘inspect’ the state of things sees values that are skewed in one direction, and it has long been studied in renewal theory, the branch of probability that deals with events that repeat over and over.
In this article, we will look in turn at the waiting-time paradox that appears at the bus stop, the principle by which long gaps are picked more often, examples from lecture halls, prisons and running races, and finally how to avoid being fooled by the inspection paradox.
One Average, but a Different One for Every Observer
1. The Waiting-Time Paradox at the Bus Stop

If buses arrive every 10 minutes on average, it is tempting to think that someone who shows up at a random time will wait about 5 minutes on average. But that calculation is only correct when buses run like clockwork, exactly every 10 minutes. Real buses speed up and slow down with traffic lights and road conditions, so the gaps between them stretch and shrink.
(1) Uneven gaps make the wait longer
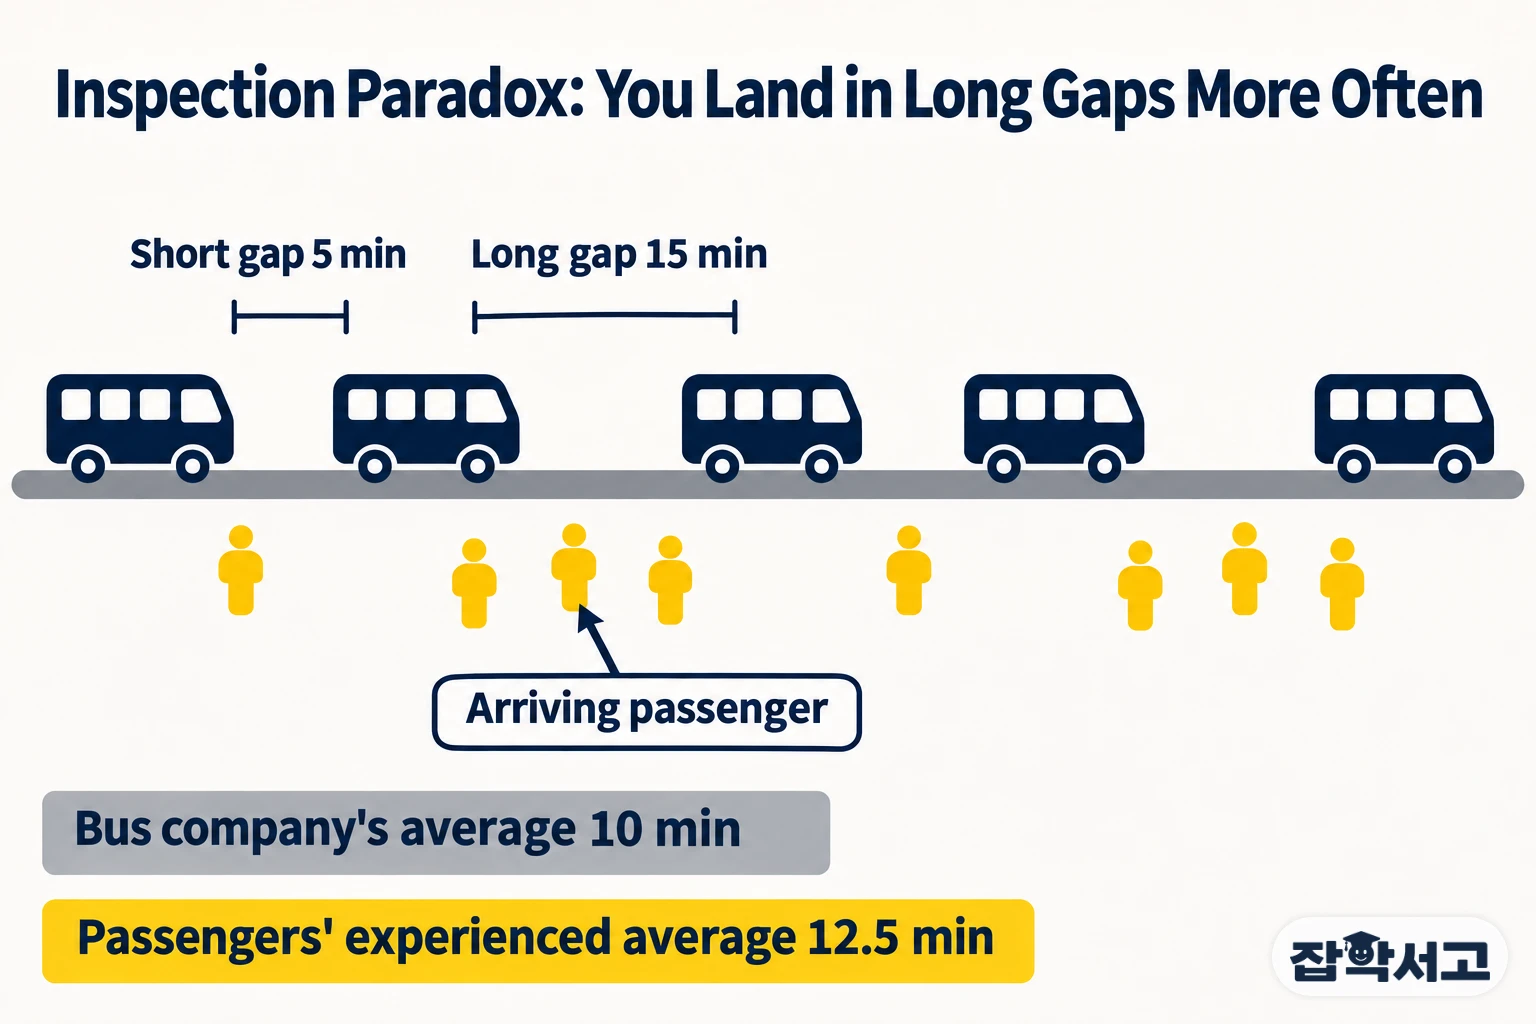
Suppose buses alternate between 5-minute and 15-minute gaps. The average gap is still 10 minutes, but the 15-minute gaps take up three quarters of the day. So a passenger who arrives at a random time is likely to land in a long gap, and the average wait grows not to 5 minutes but to 6.25 minutes.
(2) If buses arrive completely at random, you wait 10 minutes
If buses arrive at random and independently of one another, following a Poisson process, then with an average gap of 10 minutes the passenger’s average wait is also 10 minutes. This result—waiting for the whole gap rather than half of it—is known as the ‘waiting-time paradox’ and is a classic example that also appears in William Feller’s probability textbook.
(3) Real subway records confirm it
Computer scientist Allen Downey analyzed records of 70 trains on the Red Line of the Boston subway in the United States between 4 and 5 p.m. The average gap between trains was 7.8 minutes, while the average time passengers actually waited was 4.4 minutes—about 15% longer than the expected 3.8 minutes.
2. Why Long Gaps Get Picked More Often

The root of the inspection paradox lies in what the sample is based on. If you count each gap once, you get the true average; but if you pick a random point on the timeline, the longer the gap, the more room there is for that point to fall in, so it is picked more often. In the example above, the bus company sees an average gap of 10 minutes, but if you average only the gaps that passengers actually landed in, you get 12.5 minutes.
- Size-biased sampling: A sampling method in which larger or longer items are more likely to be chosen in proportion to their size; it is also called length-biased sampling.
- Renewal theory: The branch of probability that studies processes in which the same event repeats, like replacing a worn-out part, and that explains the inspection paradox mathematically.
- Poisson process: A process in which events occur at random at a constant average rate without influencing one another.
- Mean waiting time: The average of the squared gaps divided by twice the average gap; the more irregular the gaps, the longer it becomes.
In the end, the wait equals half the gap only when all gaps are equal, and the more irregular the gaps, the longer the time passengers feel. The bus company’s average and the passengers’ average differ not because one of them is wrong, but because the same phenomenon is sampled in different ways.
3. Examples from Lecture Halls, Prisons and Running Races
The inspection paradox appears not only with time but also when counting people and groups. In his blog post “The Inspection Paradox is Everywhere,” Downey collected examples hidden throughout everyday life.
(1) Classes feel more crowded to students
In Purdue University data for the 2013–2014 academic year, the average class size reported by the school was 31, but when averaged over the classes each student actually took, it was 56. Large classes contain many students, so when you ask students, each large class is counted as many times as it has students.
(2) Sentences look longer from inside a prison
In Downey’s estimate based on U.S. Sentencing Commission data, the average sentence handed down was 121 months, but averaging the sentences of the inmates you would meet on a visit to a prison on a given day gives 183 months. The longer someone’s sentence, the longer they stay in prison and the more likely you are to meet them that day.
(3) At a running race, you only see people whose speed differs from yours
When Downey took part in a 209-mile relay race in New Hampshire, he noticed that the runners who passed him or whom he passed were all unusually fast or unusually slow. Since you rarely cross paths with people running at about your own speed, the runners you meet on the course are skewed toward those whose speed differs greatly from yours.
4. How Not to Be Fooled by the Inspection Paradox

This phenomenon was noticed early on. Japanese physicist Torahiko Terada, in his 1922 essay “On Congested Streetcars,” observed the streetcars of Tokyo and discussed how long people wait and how crowded the cars become; the essay is counted among the early records that treat the waiting-time paradox scientifically. Because the inspection paradox is a difference in perspective rather than a calculation error, most of the confusion disappears once you are clear about what you want to know.
(1) First decide whose average it is
The average seen by the operator and the average experienced by users answer different questions. For assigning classrooms or planning budgets, the per-class average is appropriate; for looking at the learning environment students actually experience, the per-student average is appropriate.
(2) Correct by counting large items less
If the data were collected from users, you can recover the original distribution by giving each value a weight inversely proportional to its size. Instead of simply averaging the class sizes reported by surveyed students, you give larger classes less weight.
(3) Even out the gaps and the wait gets shorter
Even with the same number of buses, evening out the gaps brings passengers’ average wait close to half the gap. That is why schedule adjustments that keep buses from bunching together make such a noticeable difference for passengers.
Simply making a habit of asking ‘Whose eyes was this average counted through?’ whenever you hear an average can help you avoid many misconceptions. The simple thought that the spot where you stand may already be tilted toward the long side—that is the first step to understanding the inspection paradox.