Even a small convenience store displays thousands of products, and a factory parts warehouse holds tens of thousands of items. Counting, ordering, and managing every one of them with the same care would take endless people and time. Yet when you actually look closely, the items that tie up a lot of money are fewer than you might think.
The method that put this fact to work in inventory management is “ABC Analysis.” ABC analysis is an inventory classification technique that divides inventory into three classes, A, B, and C, based on each item’s annual usage value, and applies a different level of management to each class.
In this article, we will look in turn at the background from which ABC analysis emerged, the basic principle of dividing the classes, the actual order of the analysis, and how each class is managed, along with the other analyses that make up for its limits.
Inventory Management That Focuses Effort on the Important Few
How ABC Analysis Came About
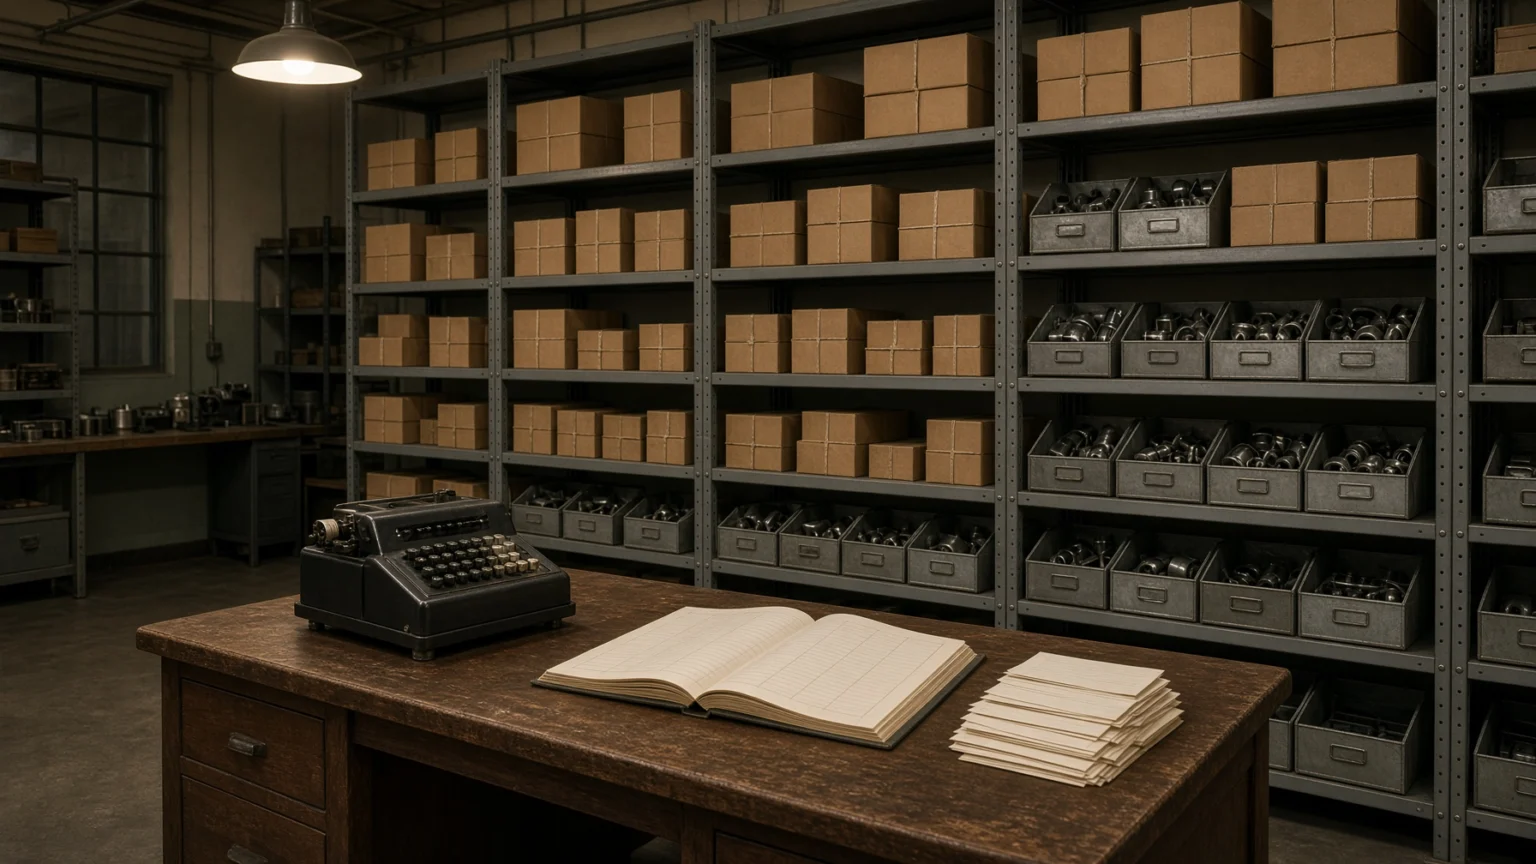
At the root of ABC analysis lies a long-standing observation that a small number of elements account for a large share of the overall result. When this observation met the numbers in factory warehouses, it took hold as a management technique.
(1) The observations of Pareto and Juran
The Italian economist Vilfredo Pareto noted that in the distribution of wealth, a small minority holds a large share. The quality management expert Joseph M. Juran summed this up in the phrase “the vital few and the trivial many” and applied it to management problems in general.
(2) General Electric’s inventory classification
In 1951, H. Ford Dickie of General Electric in the United States published an article whose message was that “ABC inventory analysis shoots for dollars, not pennies.” He introduced a method of dividing inventory into three groups by share of value and varying the level of detail in management for each group, and this is regarded as the starting point of today’s ABC analysis.
(3) A basic tool of inventory management
ABC analysis later became a basic tool found in every purchasing and inventory management textbook. Beyond inventory, the same principle is widely used to divide customers, suppliers, and products by how much they contribute to sales.
The Principle of the Three Classes A, B, and C
ABC analysis starts from the premise that not all inventory has the same value. That is why it divides the classes not by the number of items but by the value the items account for.
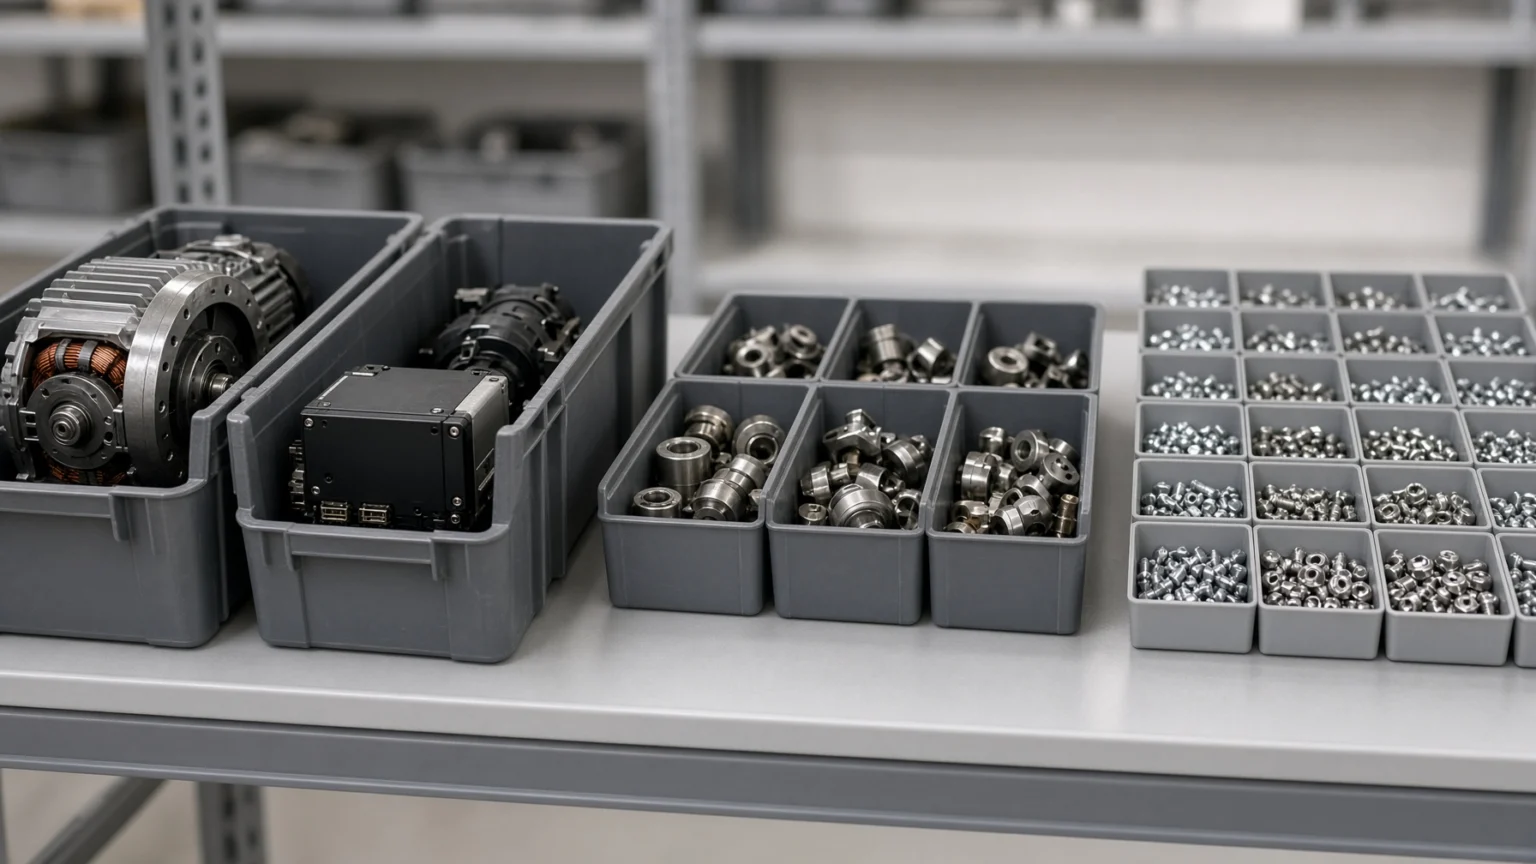
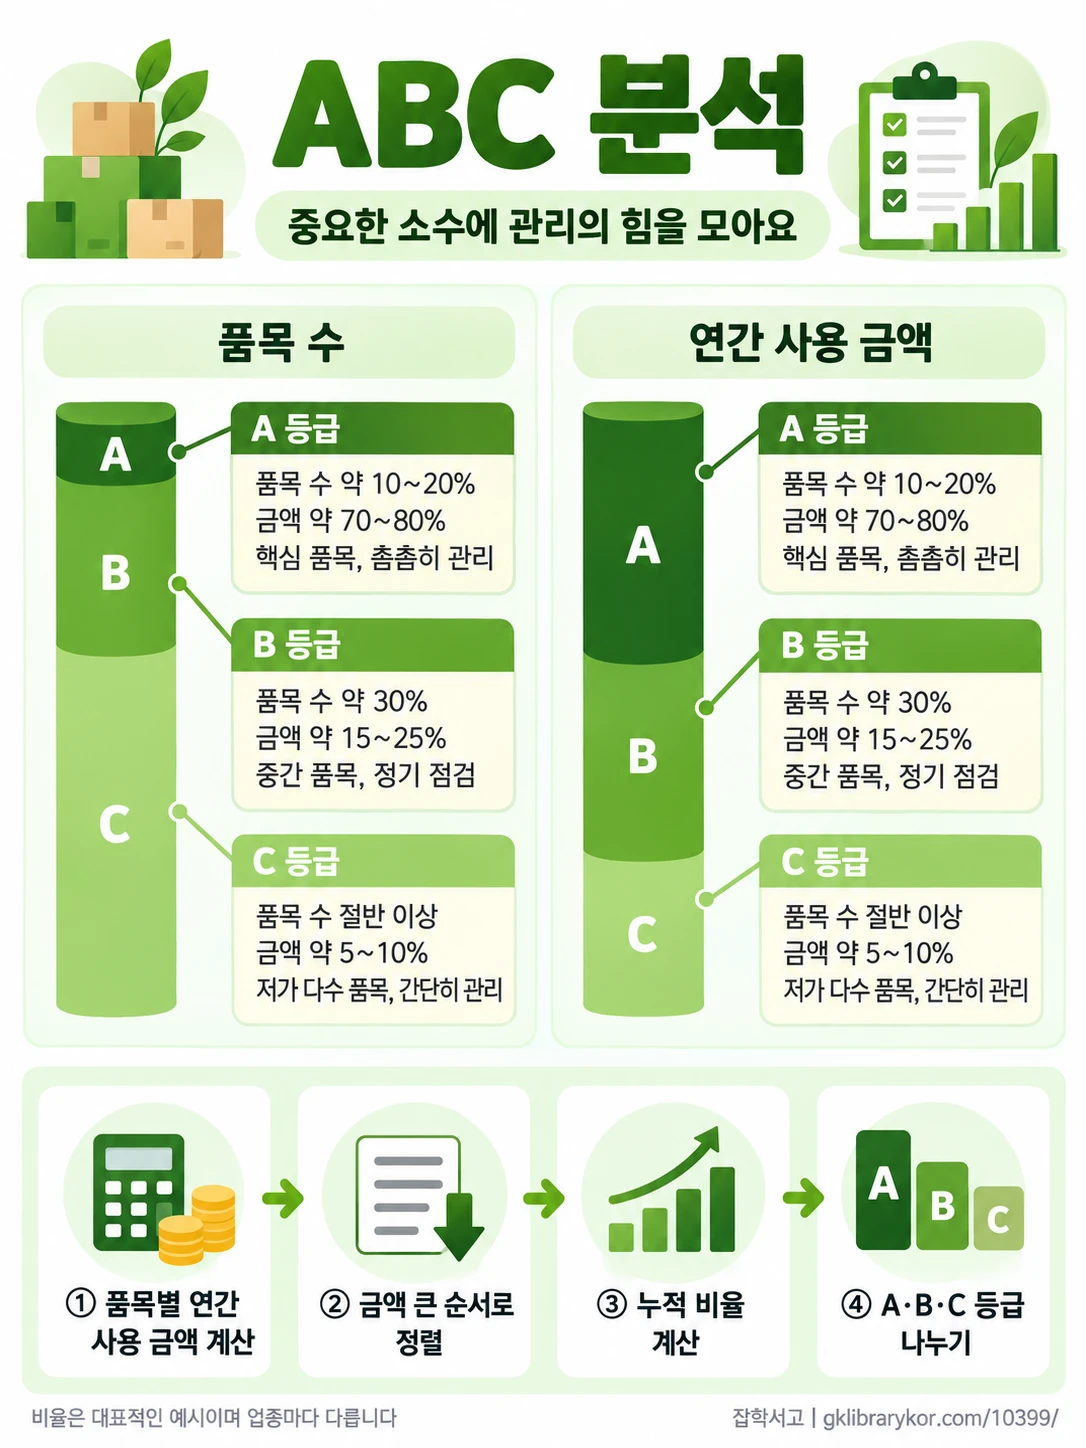
- Class A (A Items): Core items that make up only about 10–20% of the number of items but account for about 70–80% of annual usage value.
- Class B (B Items): Mid-level items that make up about 30% of the number of items and about 15–25% of the value.
- Class C (C Items): The many low-cost items that make up more than half of the number of items but only about 5–10% of the value.
These percentages are not fixed rules but simply commonly used examples. Because every company has different goals and a different mix of items, each sets the boundaries between classes to suit its own circumstances.
For example, in a factory that uses 1,000 kinds of parts, a few dozen kinds of expensive motors or control units often account for most of the value, while hundreds of kinds of consumables such as screws and washers do not add up to much even all together.
The key point is that managing just the small number of A items well lets you control most of the money tied up in inventory. Conversely, putting as much effort into the many C items as into A items yields little effect for the effort spent.
How the Analysis Is Carried Out

ABC analysis can be done with nothing more than a spreadsheet program, without complicated calculations. It is also included as a basic feature in most enterprise resource planning (ERP) systems.
(1) Calculate annual usage value
For each item, multiply the quantity used over a year by the unit price to get the annual usage value. Even a cheap screw can add up to a large amount if it is used in huge quantities, so quantity and unit price must be considered together.
(2) Sort by value
Arrange the items in order from the largest annual usage value to the smallest. This gathers the items that take up the most money at the top, making them stand out.
(3) Calculate cumulative percentages
Starting from the top, add up the number of items and the usage value in turn, and find the cumulative percentage each represents of the total.
(4) Find the boundaries with a curve
If you draw a curve with the cumulative percentage of items on the horizontal axis and the cumulative percentage of value on the vertical axis, it rises steeply at first and then gradually levels off. The boundaries between A, B, and C are set around the points where the slope bends sharply.
Management by Class and Complementary Analyses

Once the classes are divided, different rules are applied to each class. However, because it looks at only one criterion, value, it can miss some things, so it is often supplemented with other analyses.
(1) A different level of management for each class
A items are ordered frequently in small amounts, with demand forecasts and inventory records managed precisely and physical counts carried out often. C items are ordered generously at one time and managed with simple rules, reducing the labor spent on ordering and checking.
(2) Also used for warehouse layout
In warehouses, ABC classes are also used for layout, for instance by placing frequently shipped items close to the exit. In this case, the classes are divided by the number of shipments rather than value, reducing the distance workers have to travel.
(3) When value alone is not enough
Some parts are cheap but, without them, the entire production line stops. That is why XYZ analysis, which looks at demand variability, or VED analysis (Vital, Essential, Desirable), which weighs how essential an item is, is used alongside it to fill the gaps in a classification that looks only at value.
ABC analysis prevents the mistake of trying to look after everything equally and missing what really matters. Because it decides where limited people and time should be spent first, it becomes the basis for setting priorities not only in inventory management but across purchasing and warehouse operations as a whole.
Sorting out what matters more first and dividing management effort appropriately: that is the first step toward efficient inventory management.