A person visiting a welfare center or counseling agency for the first time has to tell their story from beginning to end in words. When circumstances involving work, school, hospitals, relatives, and even neighbors are explained only in words, both the listener and the speaker can easily lose their way. At moments like this, when a social worker starts drawing circles and lines on a sheet of paper, the tangled picture of a life falls into place at a glance. This drawing is the ‘Ecological Map’.
Put simply, an ecological map is ‘an assessment tool that places a family or individual in a central circle and draws their relationships with surrounding outside systems, such as work, school, hospitals, relatives, and neighbors, using different line styles to show strong ties, weak ties, and conflict on a single page’. It is often shortened to Eco-map and is one of the most widely used drawing tools in social work practice.
In this article, we will look in turn at how the ecological map came about, how to draw it and what its lines mean, how it is used in counseling, and what to keep in mind when using it.
The Ecological Map: Capturing a Life's Relationships on One Page
Seeing a Family's Environment Through a Picture Instead of Words

The ecological map was devised in 1975 by the American social work scholar Ann Hartman. At the time, Hartman was taking part in a child welfare training project at the University of Michigan School of Social Work and was looking for a way for social workers in public child welfare to easily examine what families needed. The tool became widely known through a paper published in 1978 in the journal Social Casework.
Hartman turned to drawing for the following reasons.
(1) The limits of written records
When the many relationships surrounding a family are summarized only in writing, how those relationships interlock with one another can easily become blurred.
(2) The person-in-environment perspective
Social work sees a person's difficulties not as that person's problem alone but within the relationships they have with the environment around them. The ecological map is a tool that makes this perspective visible.
(3) A conversation drawn together
When the social worker and client draw together with the paper between them, counseling changes from a time of questions and answers into a time of looking at things together.
In the same paper, Hartman also introduced the genogram, which maps family relationships across several generations. If the genogram shows the history within a family, the ecological map shows the relationships the family now has with the outside world, so the two complement each other.
How to Draw It with Circles and Lines
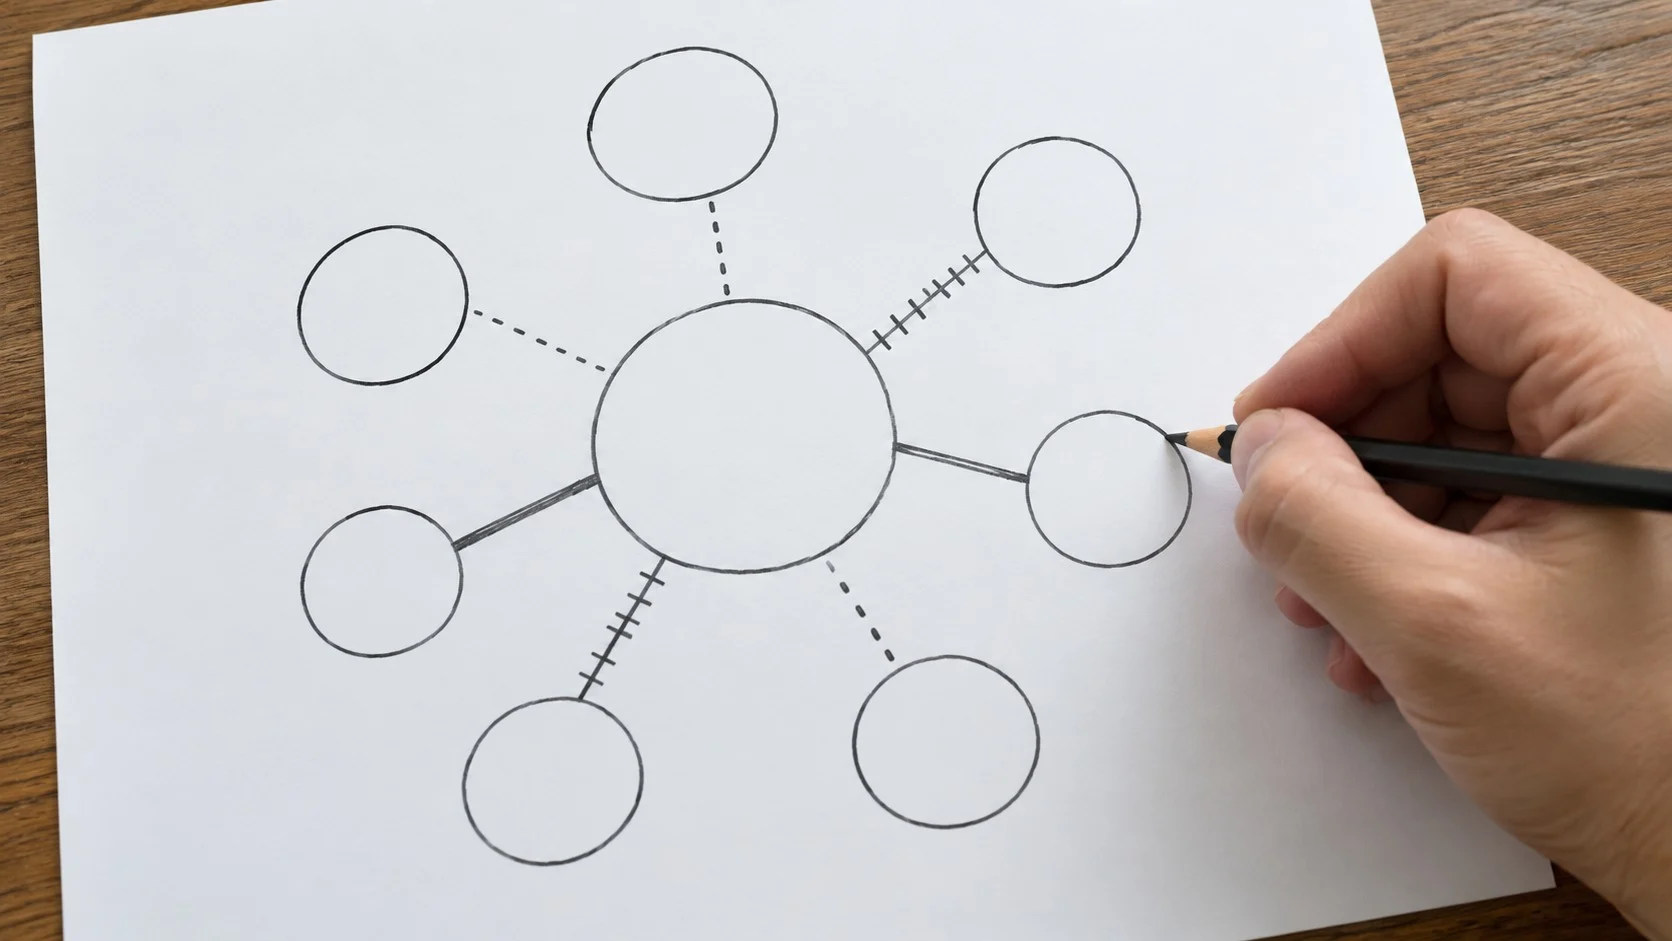
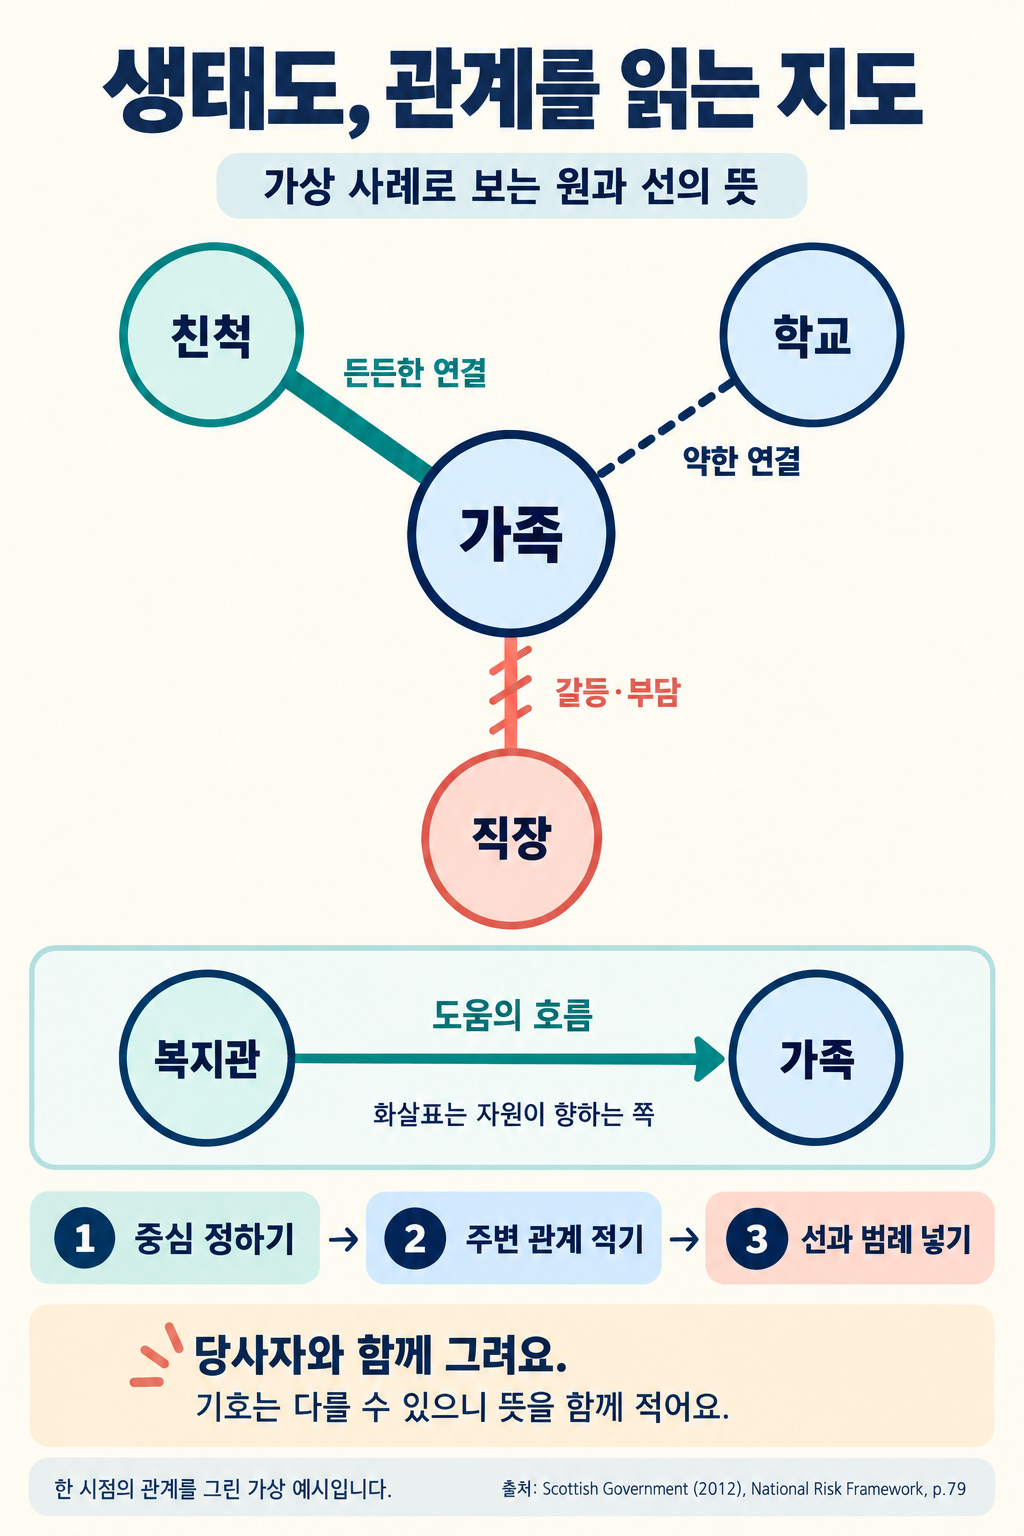
The steps for drawing an ecological map are simple. Draw a large circle in the middle of the paper and write in the family members who live together, then draw small circles around it and write in, one by one, the outside systems the family has relationships with. Work, school, hospitals, relatives, religious institutions, leisure activities, and welfare agencies are common entries, and systems specific to each family are written into empty circles.
Next, the central circle and the outer circles are connected with lines, and the shape of each line shows the nature of the relationship.
- Thick solid line (Strong Connection): a helpful and important relationship.
- Dotted line (Tenuous Connection): a relationship that exists but is weak and loose.
- Hatched line (Stressful Connection): short slashes drawn across the line indicate a relationship with conflict or stress.
- Arrow: shows which way help, attention, or energy flows.
A line can connect to the whole family or to just one member of it. Because symbols differ slightly from agency to agency and textbook to textbook, writing the meaning of the symbols in a corner of the drawing makes it easy for others to read as well.
Using the Ecological Map in Counseling

With an ecological map, the conversation shared while drawing matters more than completing the picture itself. Hartman originally set out three types of lines, but she believed that when it is used as a counseling tool, it is better to have clients describe their relationships in their own words and write those words beside the lines than to assign fixed meanings to them.
- Strength Finding: relationships connected by thick solid lines become resources to lean on in hard times.
- Gap Finding: areas with no lines at all point to where services need to be connected.
- Change Tracking: placing the first ecological map side by side with one drawn a few months later lets you compare at a glance how the relationships have changed.
For these reasons, the ecological map is used not only in child welfare and family counseling but also widely in elder care, disability support, and case management, which links multiple services together.
Things to Keep in Mind When Drawing an Ecological Map

The ecological map is an easy and powerful tool, but a single drawing cannot capture everything about a person's life.
What to Remember When Drawing Together
- Client Perspective: whether a relationship is good or bad should be drawn as the person themselves feels it, rather than judged by the social worker.
- Snapshot: an ecological map only shows relationships as of the day it was drawn, so it should be redrawn when circumstances change.
- Privacy Protection: because it contains sensitive information about the family and the people around them, care is needed in storing and sharing it.
With just a few circles and lines, an ecological map shows what kinds of relationships a person is living within. The solid sources of support and the broken links that were hard to see in words finally take shape on the paper.
Difficulties do not lie only within a person, and clues to solving them are hidden in the relationships around them. Drawing together the connections that surround a person is the first step in welfare work toward fully understanding that person's life.