
The price of a carton of milk bought at the supermarket does not cover only the work of milking cows on the farm. Countless activities are folded into it: hauling the raw milk, sterilizing and packaging it, moving it to the store by refrigerated truck, advertising it, and even replacing defective products. The tool that views this linkage of activities a company goes through to deliver value to customers as a single chain is the ‘Value Chain.’
Put simply, the value chain means ‘a framework that breaks a company’s work down into individual activities to see at which stage value is created and at which stage costs leak.’ Michael Porter of Harvard Business School first presented it systematically in his 1985 book Competitive Advantage.
In this piece, we will look in turn at the basic concept of the value chain, how activities are divided, real company cases, and how to use the analysis along with its limits.
How to Read Competitiveness by Breaking Down Activities
What Is the Value Chain?

Porter believed that when a company is viewed as a single lump, the sources of its competitiveness are hard to see. So he proposed dividing the process, from the arrival of raw materials to the moment a finished product reaches the customer, into multiple activities and examining how much each activity contributes to cost and value.
(1) Look at It Activity by Activity
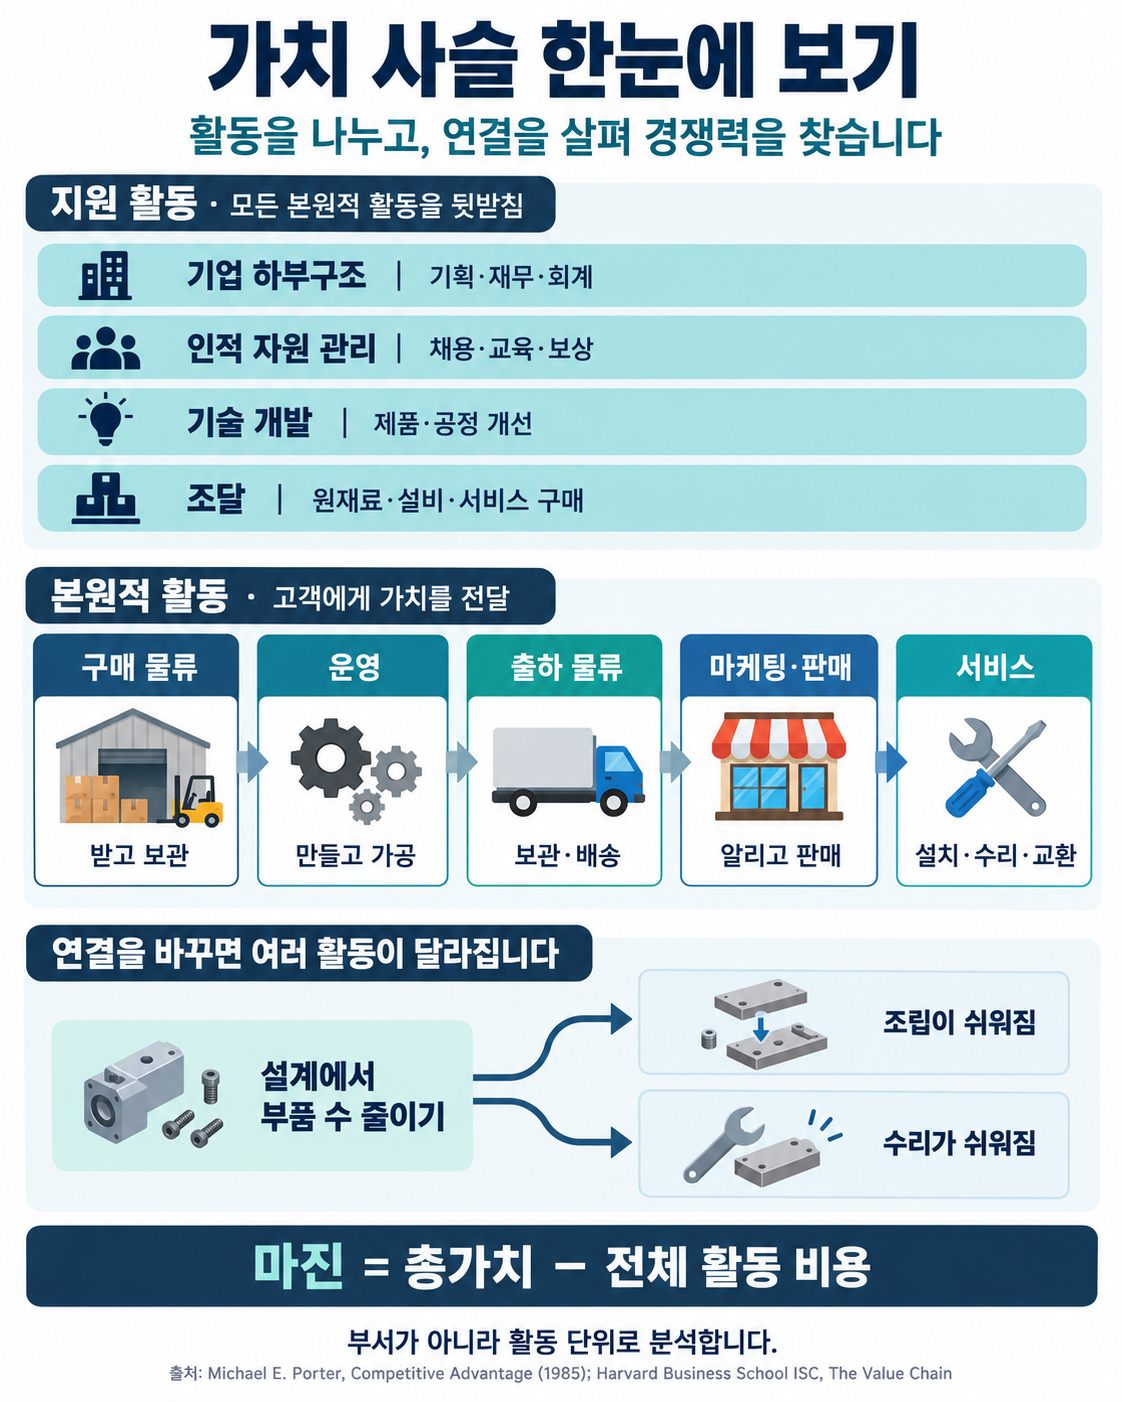
The value chain is divided by activity, not by department. Even within the same sales department, taking orders and counseling customers can be seen as different activities.
(2) The Goal Is to Leave a Margin
What remains after subtracting the cost of all activities from the total value customers pay is called the ‘Margin.’ The reason the end of the chain in Porter’s diagram comes to a point like an arrowhead is to represent this margin.
(3) Draw It for Each Business Unit
Porter believed the value chain should be drawn for individual business units rather than for the company as a whole. Lumping several businesses together hides each one’s strengths and weaknesses behind the others.
Primary Activities and Support Activities

The value chain consists of five ‘Primary Activities’ through which the product directly flows and four ‘Support Activities’ that back them up from behind. First, the primary activities are as follows.
- Inbound Logistics: receiving and storing raw materials and parts and supplying them to production.
- Operations: the production activity that turns raw materials into finished products or services.
- Outbound Logistics: storing finished products and delivering them to customers.
- Marketing and Sales: letting customers know about the product and getting them to buy it.
- Service: activities such as installation, repair, and exchange that protect the product’s value even after the sale.
Support activities do not stay at a particular stage but work across the entire chain.
- Firm Infrastructure: the foundation that holds up the whole company, such as planning, finance, accounting, and legal affairs.
- Human Resource Management: hiring, training, and rewarding people.
- Technology Development: the research and know-how that improve products and processes.
- Procurement: purchasing raw materials, equipment, and services from outside.
The Value Chain Through Cases

The value chain shows where a company saves money and where it creates value.
[Case 1] IKEA’s Flat Boxes
Furniture is bulky, so moving it is expensive, and it is easily damaged in transit. Starting in the 1950s, IKEA took furniture apart, packed it in flat boxes, and had customers do the assembly themselves. By cutting the waste of shipping empty space in outbound logistics and passing the cost of assembly on to customers, it created the value of a low price.
[Case 2] The Curve of a Smiling Face
Around 1992, Stan Shih, founder of Taiwan’s Acer, noticed that in the personal computer industry, the two ends of the chain, such as research and development and brand and service, carry high added value, while assembly and manufacturing in the middle carry low added value. Drawn as a graph, this forms the shape of a smiling mouth and is called the ‘Smiling Curve.’ Based on this observation, Acer concentrated its efforts on research and development and on marketing its own brand.
Uses and Limits of Value Chain Analysis

Value chain analysis is a starting point for developing a competitive strategy.
(1) Find Where to Lower Costs
Calculating the cost of each activity separately reveals the activities you are doing more expensively than your competitors. Improving those activities or outsourcing them can give you a cost advantage.
(2) Find Where to Differentiate
By finding the activities customers value especially highly and concentrating resources there, you can create value different from your competitors.
(3) Look at the Links Between Activities
Porter emphasized that the way activities fit together can matter more than each activity on its own. A good example is that reducing the number of parts at the design stage makes both assembly and repair easier.
(4) It Does Not Fit Every Industry
The value chain was built around manufacturing, which processes raw materials step by step. In 1998, Charles Stabell and Øystein Fjeldstad proposed that companies that solve customers’ problems, such as hospitals or consultancies, should be seen as a ‘Value Shop,’ and companies that connect customers with one another, such as banks or telecom carriers, as a ‘Value Network.’
The value chain shows that a company’s competitiveness is not the talent of any one department but the result of many activities meshing together. Today the concept has expanded into the ‘Global Value Chain,’ in which the design, parts production, and assembly of a single product are spread across many countries, and it is also used to explain international trade.
Laying out our own company’s chain one link at a time and honestly examining where value is created and where it leaks: that is the first step in a strategy for building a sustainable competitive advantage.