
When a checkup test said to be 99% accurate comes back positive, most people assume the chance they have the disease is about 99% too. But if the disease strikes only about one person in ten thousand, that story changes completely. Letting vivid evidence pull your attention away from how common the event usually is—that judgment trap is the base rate fallacy.
Put simply, the base rate fallacy means judging probability from the concrete details of a single case while ignoring how often the event occurs in the whole population (the base rate). The more vivid the cue—a test result, an eyewitness, a first impression—the more easily we skip the numbers underneath. Wherever probability judgments matter most—medicine, courts, hiring, security—the cost of this error grows.
In this piece we will look in turn at what the base rate fallacy means and how the research began, the calculation behind the famous cab problem, everyday examples, and finally ways to reduce the error—and where those fixes fall short.
The Number to Ask Before the Evidence: The Base Rate
What Is the Base Rate Fallacy?

A base rate is the share of a whole group that already applies before you learn any specific information. In statistics this is also called a prior probability: when new evidence arrives, the right order is to start from that prior and revise your judgment.
The psychologists who mapped this error systematically were Daniel Kahneman and Amos Tversky. In a 1973 paper they argued that people judge probability by how closely a case resembles a stereotype—what they called the representativeness heuristic.
In a well-known experiment, participants saw a character sketch drawn from a pool of 100 engineers and lawyers. One group was told there were 70 engineers; the other, 30. After reading that the person enjoyed math puzzles and carpentry, the two groups gave nearly the same answers. The moment the sketch “looked like” an engineer, the 70-versus-30 difference dropped out of the judgment.
The Cab Problem: How Strong Base Rates Really Are

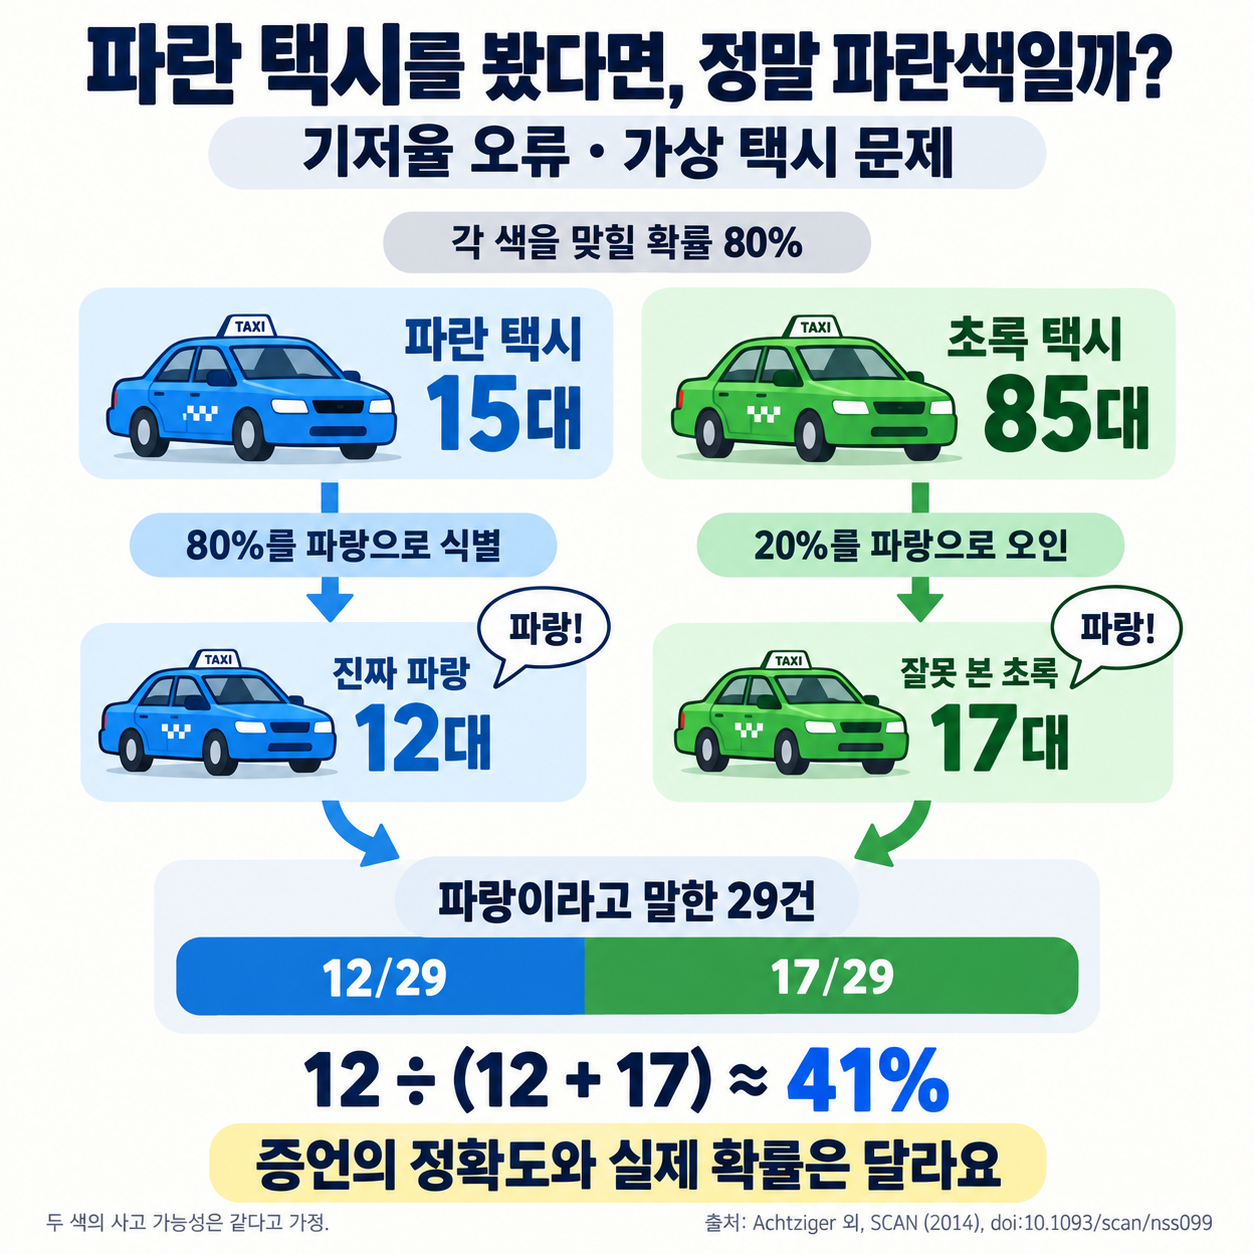
The cab problem Kahneman and Tversky introduced is the example most often used to teach the base rate fallacy. One night a hit-and-run occurs in a city where 85% of the taxis belong to a green company and 15% to a blue one. A witness says the cab was blue; tested under the same conditions, the witness correctly names the color 80% of the time.
The answer people give most often is “80% chance it was blue.” Fold in the base rate, and the result changes.
(1) Correctly spotting a real blue cab
Of 100 taxis, 15 are blue; at 80% accuracy the witness correctly calls about 12 of them “blue.”
(2) Mistaking a green cab
Of the 85 green taxis, 20%—about 17—are also wrongly called “blue.”
(3) The final probability
Of the 29 “blue” identifications, only 12 were truly blue, so the real probability is about 41%. Even with the testimony, a green cab is still more likely.
Tversky and Kahneman explained the result by noting that the 85-to-15 base-rate gap is more extreme than the witness’s reliability. However plausible the evidence looks, dropping the starting rate throws the calculation off from the first step.
Base Rate Fallacies Hidden in Everyday Life

The base rate fallacy does not live only inside textbook puzzles. It shows up more often where real decisions are made.
- Medical Screening: In a 1978 Harvard Medical School study, people were asked about a positive result when prevalence was 1 in 1,000 and the false-positive rate was 5%. The most common answer was 95%. Assuming 100% sensitivity (the proportion of people with the disease who test positive), the proportion of positive results that are true cases is 0.001 ÷ (0.001 + 0.05 × 0.999) ≈ 1.96%. Without a specified sensitivity, the exact value cannot be determined; under these conditions, about 2% is an upper bound.
- Hiring: If truly outstanding talent is only 1 in 100 applicants, many candidates who “look impressive” in interviews may still be ordinary.
- Security Alert: In a system where attacks are rare, even an accurate detector can produce alerts that are mostly false alarms.
What these share is rarity. With sensitivity and the false-positive rate held constant, a rarer target generally means a lower proportion of true cases among positive results. False positives do not necessarily outnumber true positives: that depends on the base rate, sensitivity, and false-positive rate. The base rate and test performance must therefore be considered together.
How to Reduce the Base Rate Fallacy—and Its Limits

The core habit for dodging the fallacy is to ask “How common is this usually?” before looking at the evidence, then adjust that number by how accurate the evidence is. That is the mindset Bayes’ Theorem describes.
(1) Check the base rate first
Before you conclude, find out how often similar cases occur in the whole population.
(2) Switch to natural frequencies
Counts such as “12 out of 100” are far more intuitive than bare percentages like “80%.” The psychologist Gerd Gigerenzer has shown that this framing sharply raises the rate of correct answers.
(3) Separate inverted probabilities
Keep clear that “the chance of saying blue given a blue cab” and “the chance it is blue given someone said blue” are different numbers.
Base rates are not a cure-all, though. An outdated or badly counted base rate can warp judgment further. And mechanically applying a group average to an individual can become a tool that justifies stereotyping and discrimination. A base rate is a starting point for judgment—not a brand that pre-labels a person.
The base rate fallacy appears when vivid evidence drowns out quiet numbers. Since Kahneman and Tversky’s experiments, the idea has become a key standard wherever probability judgments matter—medical diagnosis, courts, hiring, and security.
When striking evidence arrives, asking once more how common the event usually is is the first step toward a rational judgment that is not fooled by the numbers.