
When we look for the restroom or the exit on an airport sign, or see a chart in a news article lined with rows of human-shaped icons, we grasp the content without reading much text at all. Being able to find our way with a single picture even in a country where we don't speak the language now feels like a matter of course.
This way of conveying information through simple picture symbols has a clear starting point. About 100 years ago in Vienna, Austria, a philosopher and economist set out to turn difficult statistical figures into pictures that workers and children could understand at a glance, and that method later came to be called “Isotype.”
In this article, we will look in turn at the story of the Viennese museum where Isotype was born, the core rules that let people read pictures by counting them, the people who created it together, and the traces it has left on today's infographics and pictograms.
A Language That Lets Numbers Be Read as Pictures
Neurath and the Social and Economic Museum of Vienna
The person who first conceived Isotype was Otto Neurath of Austria. He was a scholar who led the Vienna Circle, a group of philosophers of science, as well as a social scientist who studied statistics and economics.
(1) A Museum for Learning, Not a Treasure House
In 1925, with support from the City of Vienna, Neurath opened the Social and Economic Museum. He wanted it to be not a place for storing rare artifacts, but a place where citizens could learn about housing, health, and working conditions in their own city.
(2) Bringing Dead Statistics to Life
In Neurath's view, tables full of numbers were “dead statistics” to ordinary citizens. So the museum printed several copies of its pictorial charts for exhibitions and used them in both permanent and traveling exhibitions, so that people could see statistics with their own eyes and remember them.
(3) Words Divide, Pictures Unite
In Vienna, where people speaking many languages lived together, Neurath hung the motto “Words divide, pictures unite” on his office wall. The method was at first called the “Vienna Method of Pictorial Statistics.”
The Rule of Showing Quantity by Number, Not Size
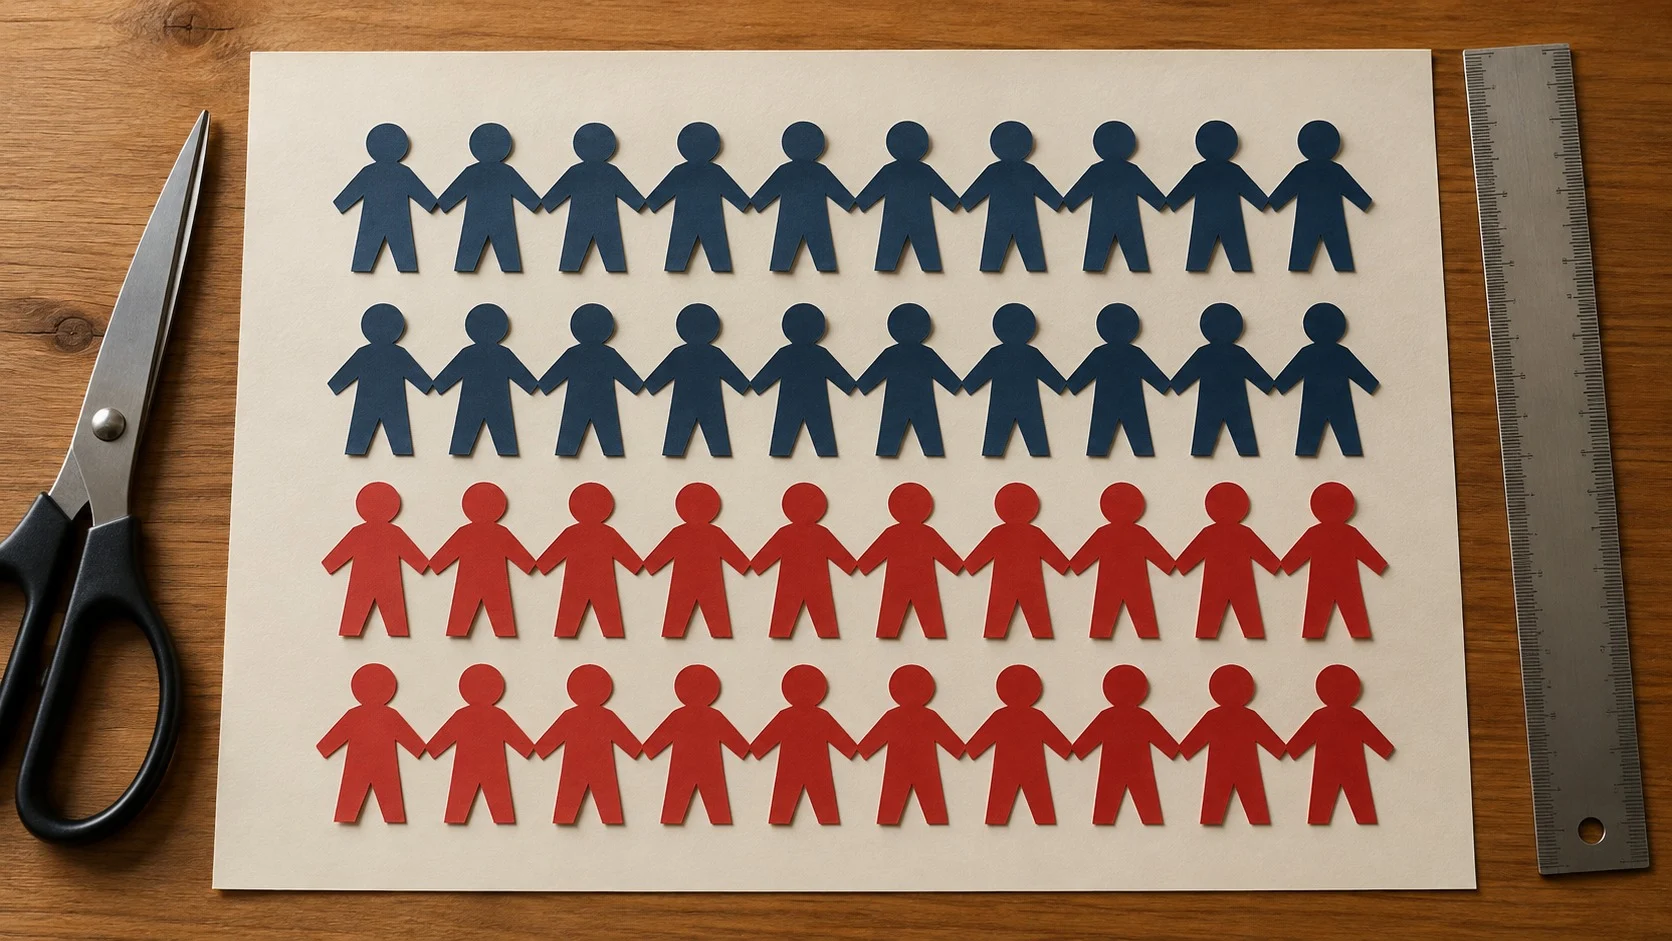
The most important rule of Isotype is that a large quantity is not drawn as a large picture. Instead, symbols of identical size are repeated and lined up. Based on this, Neurath established several principles.
- Serial Repetition: If one person stands for 1 million people, then 3 million people are shown with three identical person symbols, so that they can be counted one by one if needed.
- The pitfall of Size Comparison: If a symbol is enlarged to twice its size, it becomes unclear whether to compare height or area, so changing the size of symbols is avoided.
- Flat Pictogram without perspective: Adding near-and-far effects makes the same symbol look different, so symbols are almost always drawn as flat silhouettes seen from the front or the side.
- Helping Language: Isotype was designed not as a language that replaces words, but as a device used together with short texts to aid understanding.
Neurath set out these rules in his 1936 book International Picture Language, and the museum adopted the motto “It is better to remember simplified pictures than to forget accurate figures.”
The People Who Made It Together
Isotype was not one person's invention but, from the very beginning, the work of a team of people working in step. In effect, it already had a division of labor similar to that of a modern design firm.
(1) The Artist Who Carved the Symbols: Gerd Arntz
The German-born printmaker Gerd Arntz caught Neurath's eye with his simple, powerful woodcut style and worked at the museum from 1929. Over his lifetime he designed some 4,000 symbols, such as people, factories, ships, and grain.
(2) The Transformer Who Turned Data into Pictures: Marie Reidemeister
Reading complex statistical data and sketching out what pictures would show it was called “transformation.” Marie Reidemeister, who took on this work, later married Neurath and became Marie Neurath.
(3) A New Name: an International System
In 1930, the team published Gesellschaft und Wirtschaft (Society and Economy), a large atlas of 100 pictorial statistics charts. Around 1935, the method was given the name Isotype, taken from the initials of “International System of Typographic Picture Education.”
Exile and Today's Infographics

Isotype did not grow up in a peaceful environment. Yet as it moved from country to country to escape political upheaval, it spread all the more widely across the world.
(1) From Vienna to The Hague, Then to Britain
When civil war broke out in Austria in 1934 and fascism gained the upper hand, the museum closed, and the three moved to The Hague in the Netherlands. When the German army invaded the Netherlands in 1940, Neurath and Marie crossed to Britain in a small boat and founded the Isotype Institute in 1942.
(2) The Work Carried On by Marie Neurath
Neurath died in 1945, but Marie Neurath carried on the work, publishing children's science books using Isotype and, in the 1950s, creating election and civic education materials for the Western Region of Nigeria. The institute's materials were donated to the University of Reading in England in 1971, where they are still kept today.
(3) Isotype All Around Us
Today's infographics that line up human-shaped icons to show populations or proportions, and the international pictograms used in airports and stadiums, are considered to have been strongly influenced by Isotype. The idea of making sure that even people who cannot read are not left out of information lives on in today's visual language.
Isotype was an attempt to make difficult numbers belong not only to experts but to every citizen. The humble method of lining up small pictures of the same size, one by one, is still alive 100 years later in signs and charts all over the world.
Drawing information so that anyone who sees it can recognize it at a glance: that is the first step of design as a discipline that designs communication.